
When the Best Sellers Rank slips, the response is almost always the same: new content, new images, a deal, and more media budget. Meanwhile a single hygiene factor moves conversion rate by more than a factor of two, and in most accounts it appears in no reporting at all.
One ASIN sat between 51,000 and 58,000 dollars a week for months. Steady enough that nobody in the reporting asked about it anymore.
The usual program is well rehearsed. Refresh the content, shoot new images, restructure the campaigns, test a price point, run a deal. And when none of that is enough, the media budget goes up, because at least that moves something in the short term. All of it costs money, and with most of these measures six weeks pass before anyone can say whether they worked.
Before we signed off on any of it, we checked one hygiene factor. How fast does this product actually reach the people searching for it?
Why conversion rate decides what a customer costs
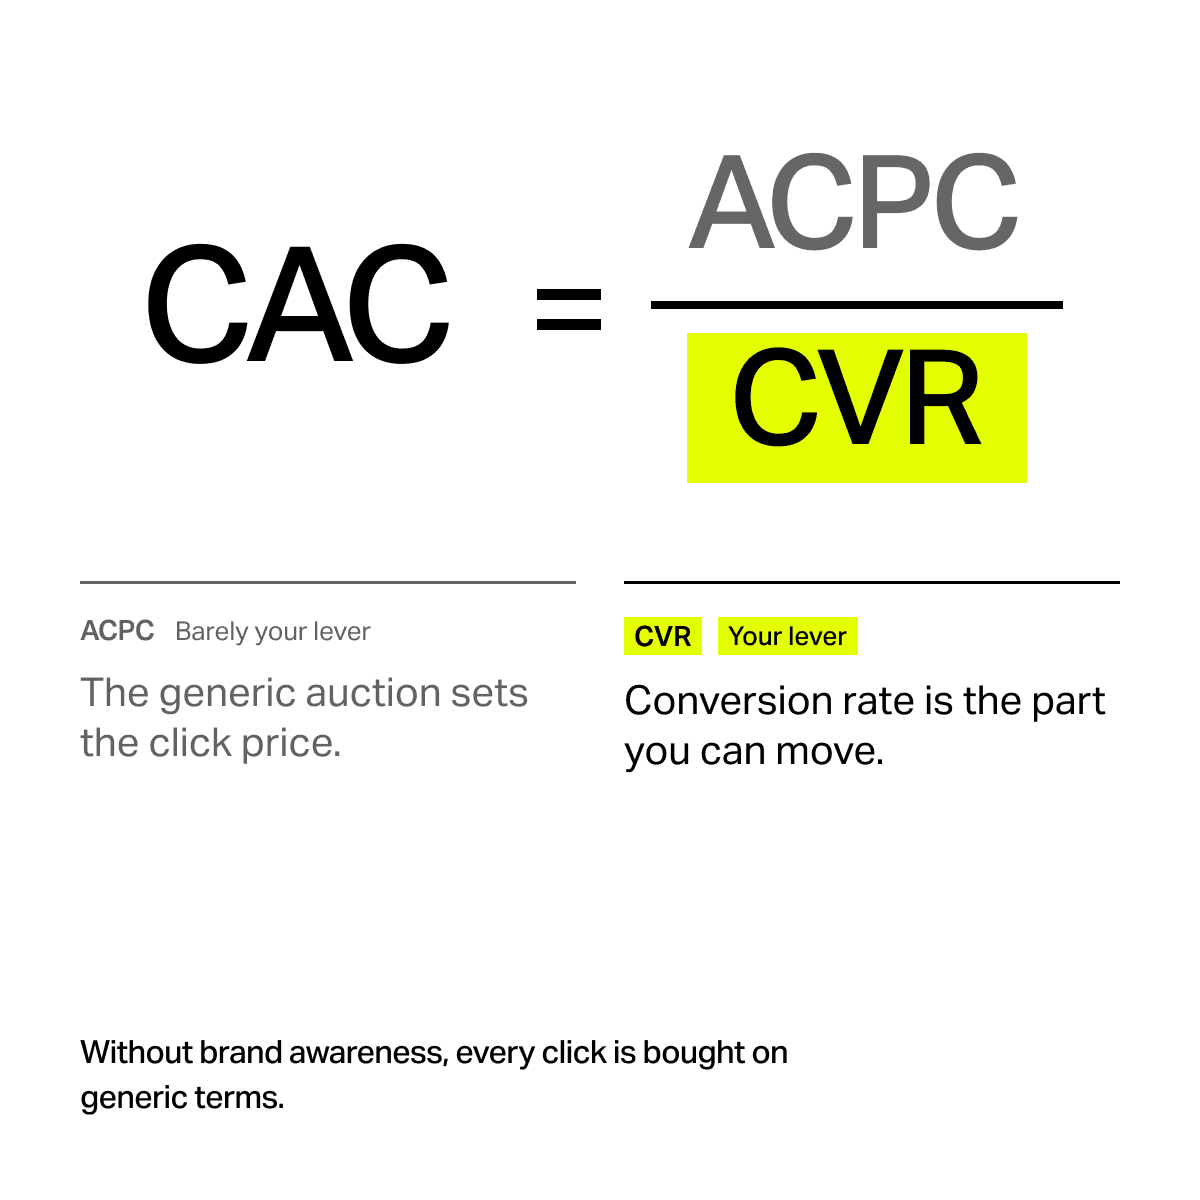
For brands without meaningful awareness in the target market there is barely any branded search. Every click has to be bought on generic terms, and that sets the price of a customer:
CAC = ACPC ÷ CVR
The average cost per click is barely your lever. The auction on the generic term sets it, together with everyone else bidding there. You can work on bids and structure, but you do not set the price formation itself.
Conversion rate is the part of the equation you can genuinely move. Every point of CVR lowers customer acquisition cost directly, without a single euro more flowing into the media budget.
That makes the real question more concrete. What has the largest influence on conversion rate?
The answer is already in your own account
Amazon's Search Query Performance report breaks conversion rate down by delivery promise, at search term level. Across more than 1,000 search terms for one brand in the US market, sales weighted, calendar week 33 produced this picture:
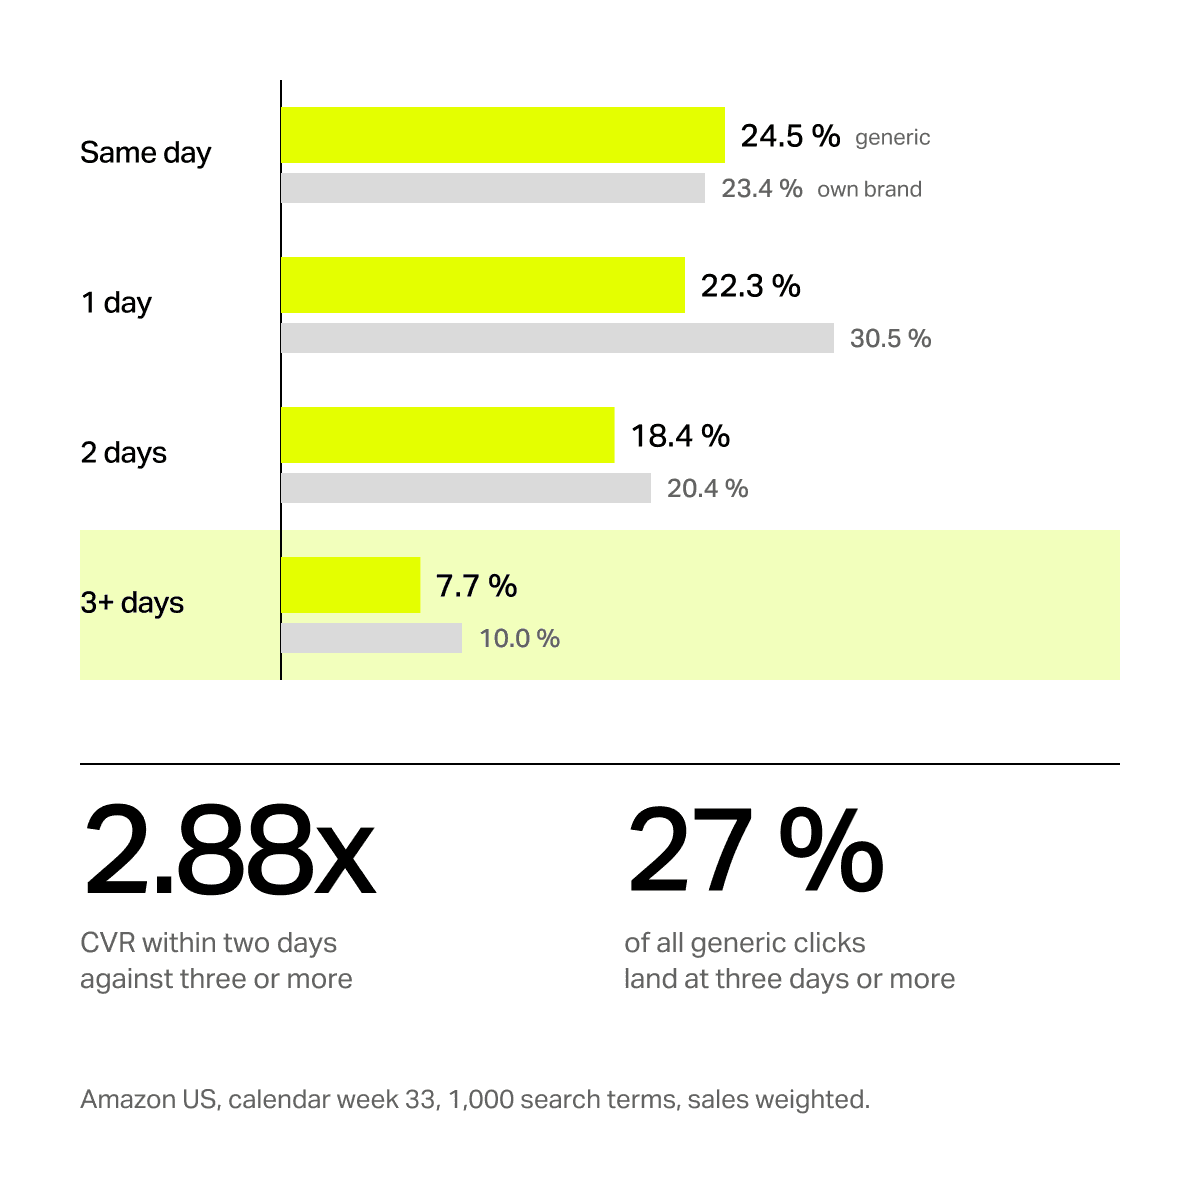
A delivery promise within two days converts 2.88 times as well as one from three days onward, at identical product, identical price and identical content.
Two things in this table deserve a second look.
27 percent of all generic clicks land in the three-day bucket. That is more than a quarter of the traffic you bought, converting at a third of the rate that would be possible. No bid and no campaign structure repairs that, because the loss happens after the click has been won.
The effect does not disappear on your own brand. Someone typing your brand name has already decided, and conversion rate still falls from 30.5 percent at one day to 10.0 percent at three days and beyond. Brand awareness does not cushion a slow delivery promise.
For context: click volumes on the own brand sit in the low hundreds in this week, so those values fluctuate more than the generic ones. The direction is unambiguous; the exact percentage points less so.
Why delivery time hits this hard in the first place
In a market like the US, Amazon builds the search results page by relevance, by purchase history, and by what arrives quickly at the individual shopper.
The delivery promise is calculated per ZIP code, against the inventory in the fulfilment centres serving that region. Two shoppers in Texas and Florida typing the same generic search term therefore do not necessarily see the same products in the same order.
An ASIN with well distributed inventory appears on page one across most of the country. An ASIN whose inventory sits in two or three regions appears on page one there and considerably further down everywhere else. The listing is the same; the shelf is a different one.
This also explains why the usual diagnosis misses. You check the ranking, it looks acceptable, and you conclude that nothing is wrong with the listing. You checked it from one location.
One lever that moves three things at once
Delivery time is worth isolating because its effects reinforce each other.
Lower delivery time leads to better organic rank, because the promise is localized and visibility rises exactly where it was weak. More impressions and more clicks follow from that.
At the same time, conversion rate rises on every one of those impressions.
Together they lower ACoS, because the same click at the same bid returns more.
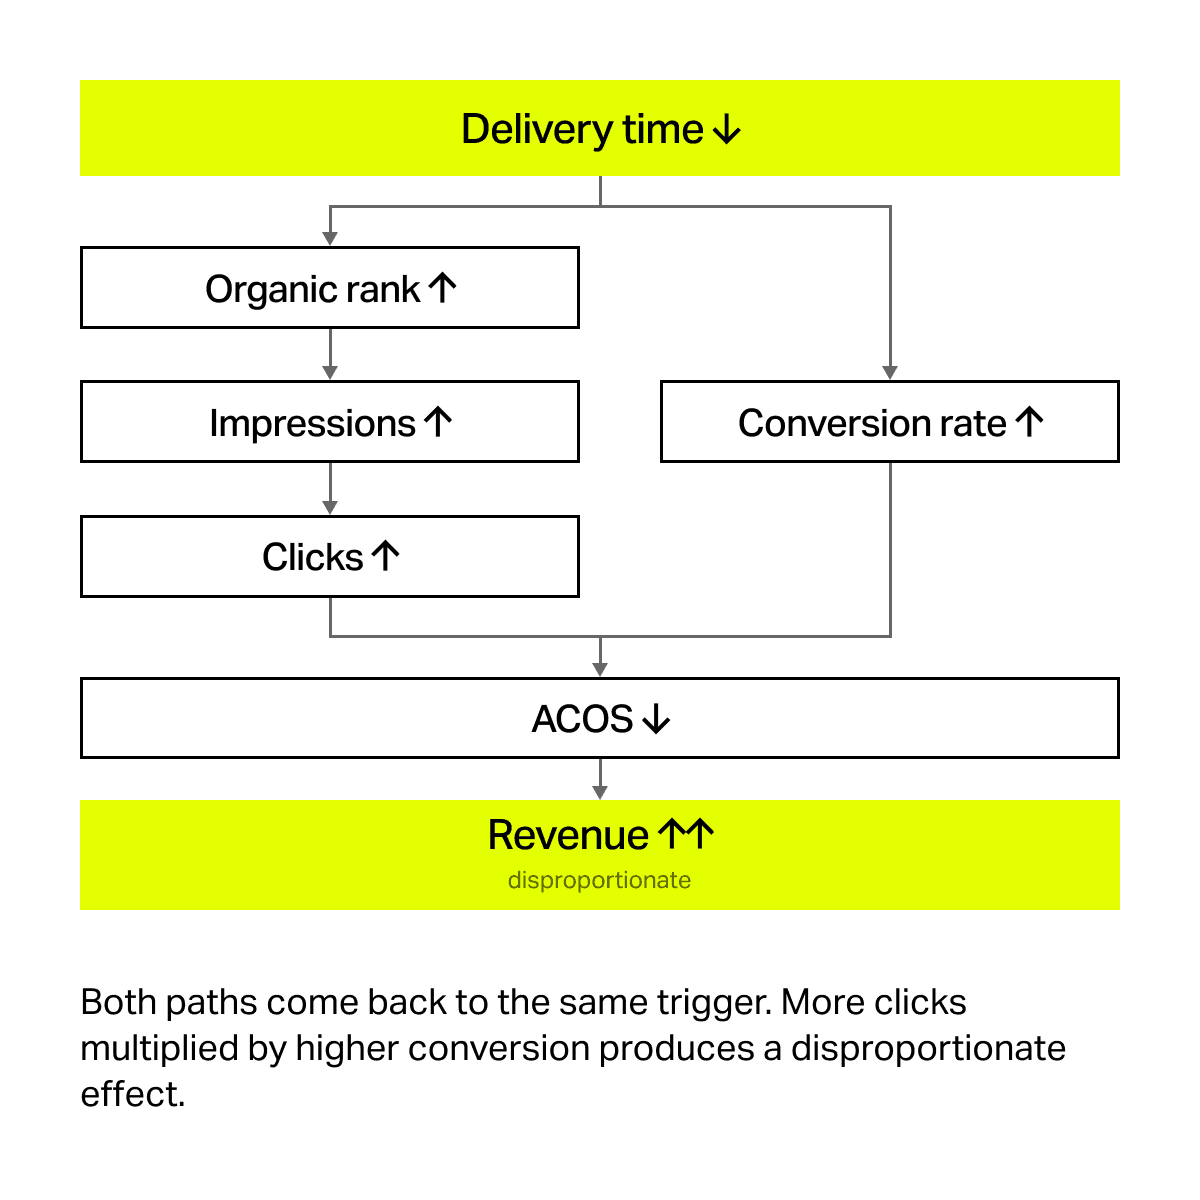
Both paths come back to the same trigger. More clicks multiplied by higher conversion produces a disproportionate revenue effect, and that is where delivery time differs from most optimizations, which move one of those figures and leave the other untouched.
How we measure it
The delivery promise only exists per destination. To read it, you change the ZIP code on the product page, one at a time.
Open the product page, change the ZIP in the delivery selector, read the promise, write it down, move to the next one. That works and it takes an afternoon.
The scale of it is the problem. Around 41,000 ZIP codes across 50 states, multiplied by every ASIN in the catalogue. And a snapshot from one afternoon says nothing about whether the picture is improving.
So, we built our own tool for it. We enter an ASIN and get a delivery map of the US across 17 measured locations, refreshed daily. The values are population weighted, so the average reflects where people actually live. Weighting Wyoming and California equally would distort the picture.
What the map showed
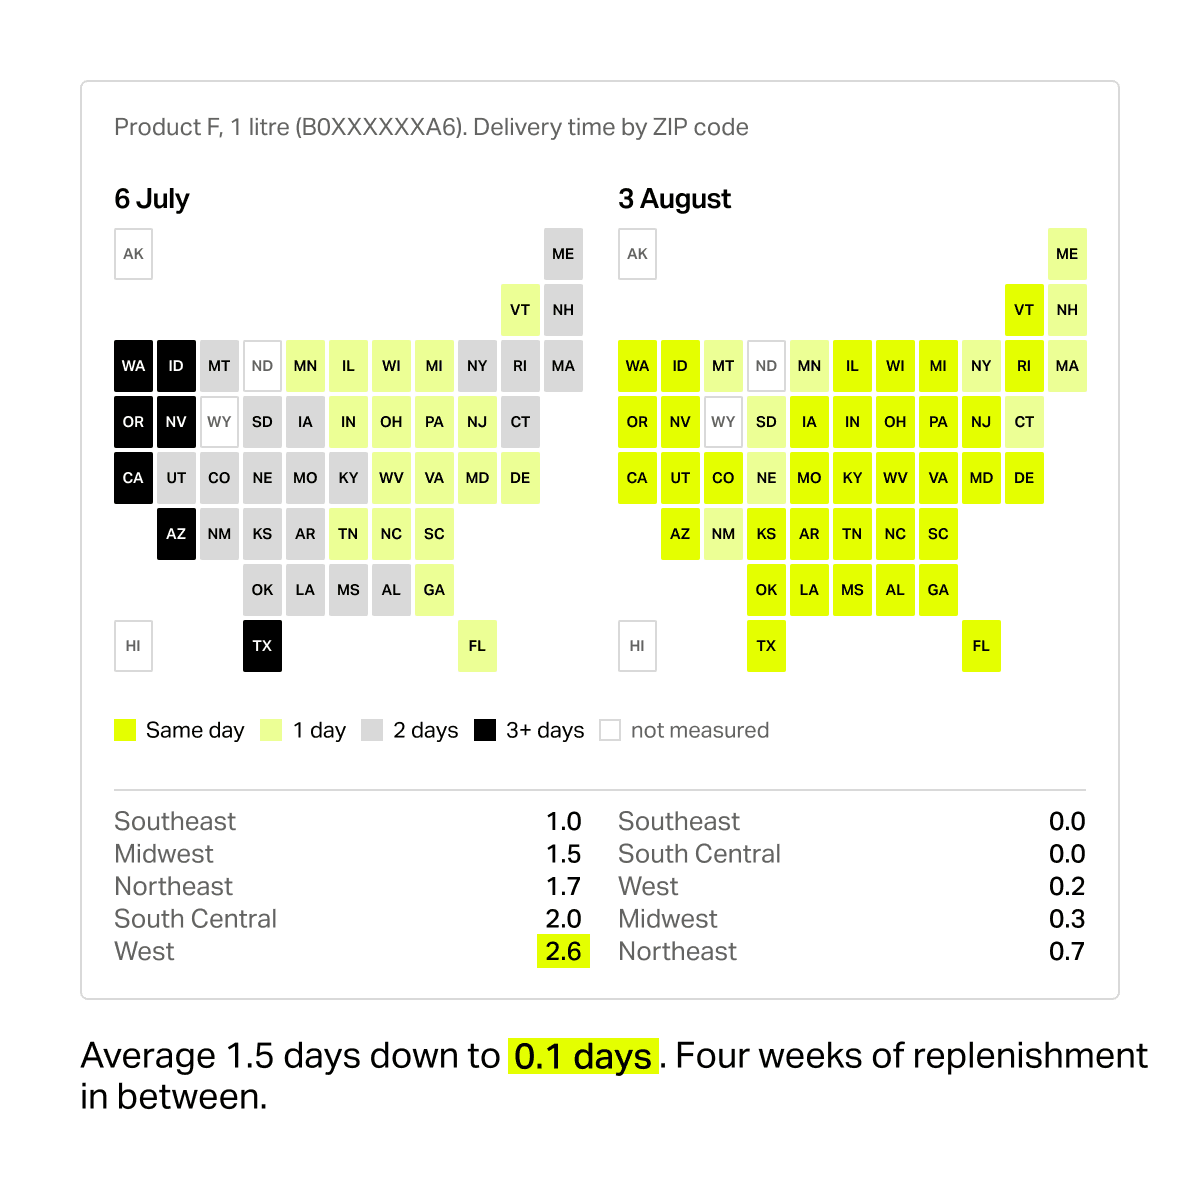
On 6 July, before any measure, the average delivery time stood at 1.5 days, population weighted. Not a single state had Same Day. 91 percent of the population was reached within two days, which sounds respectable until you look at the spread. The West sat at 2.6 days, individual states at 3 to 4.
That is the profile of a product with enough inventory in the network overall and in the wrong places.
The measure was replenishment. More stock to Amazon across weeks 28 to 30, then letting the network distribute it. No new content, no new campaigns, no price change.
On 3 August, four weeks later, it stood at 0.1 days. Same Day reached 89 percent of the population, and every region sat at 100 percent within two days. The spread between the best and weakest regions fell from 2.0 to 1.0.
Week by week
The sequence says more than the endpoint, because it shows the order in which the effects arrive.
Week 30 brings the first movement. Conversion rate picks up, rankings shift on the strongest terms.
In week 31 both jump. Eight tracked keywords move together, and sessions follow the ranking rather than leading it.
From week 32 a new plateau holds. The top keywords settle from rank 11 to rank 5.
The commercial picture across the same window (Week 28 to 35):
- Weekly revenue: $55,000 to $101,000
- Conversion rate: 12.1% to 18.1%
- Sessions: 23,900 to 29,400
- TACoS: 22% to 12%
- Top keyword rank: 11 to 5
The arithmetic behind it is worth writing out, because it shows that neither effect alone would have produced this result.
23,900 sessions at 12.1 percent conversion give the starting revenue. 29,400 sessions at 18.1 percent give roughly double. Sessions rose 23 percent, conversion rate six percentage points, and multiplied together revenue doubles.
TACoS halved from 22 to 12 percent without a single change to the campaigns. Back to the opening equation: the ACPC stayed where it was, the CVR rose by half, and the CAC fell with it.
What this means for media budgets
Optimization budgets usually flow into the things visible in the account. Creative, bids, keyword structure, placements. Those are real levers and they are worth pulling.
They are also the expensive way to buy conversion rate while the cheap way sits unexamined next to them.
If 27 percent of your generic clicks sit in a delivery promise converting at 7.7 percent instead of 22, you pay full price on a quarter of your traffic for a fraction of the result. You won the auction. You lost afterwards, on the product page.
The second consequence is harder to hear. A category cannot be led while your own delivery promise sits behind that of the current bestsellers. The category average in the SQP report is no abstract benchmark. It is the standard the leading listings already meet, and it sets the conversion rate the algorithm expects from a product in that position.
The fix is weeks of coverage
The lever itself is unspectacular. You send more stock to Amazon and build weeks of coverage.
Amazon distributes incoming stock across the network on its own, and that takes time. As a rule, three to six weeks pass before a delivery shows up in the promises of individual regions. Seller and Vendor work differently here, though the underlying mechanism stays the same.
For Sellers we recommend twelve weeks of coverage. That gives Amazon a permanent buffer to redistribute stock internally. Without that buffer, goods largely stay where they arrived.
The arithmetic you should know beforehand
At the start you have to send in an uncomfortable amount of stock, more than the current sales volume would suggest.
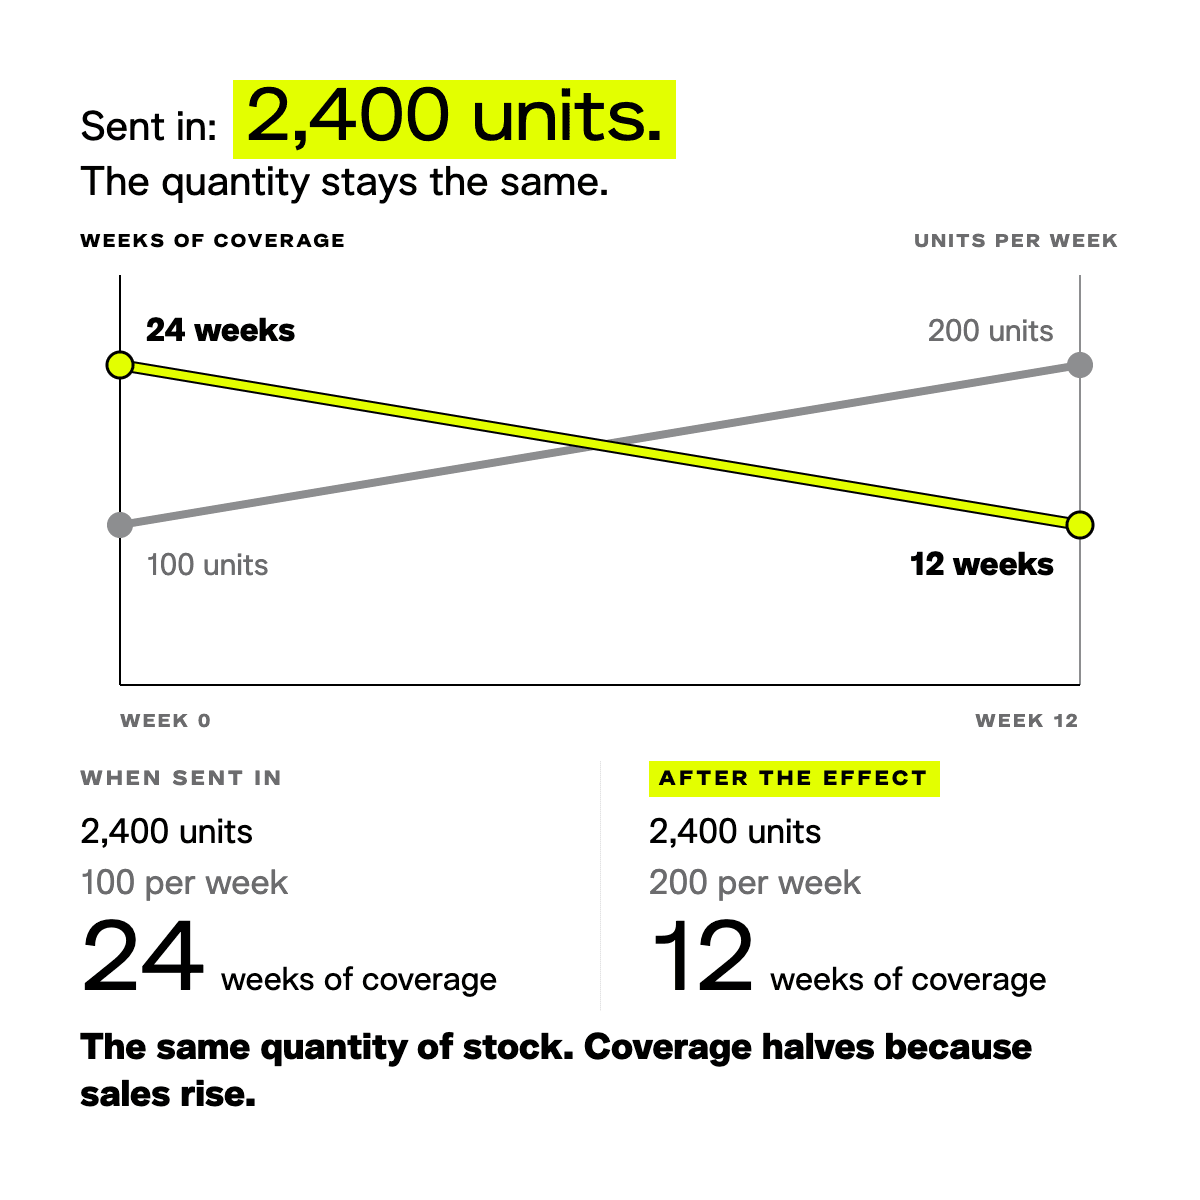
Take an ASIN selling 100 units a week today. Twelve weeks of coverage means 1,200 units in the warehouse. If sales double through the better conversion rate and the better ranking, the target volume is 200 units a week, and for that you need 2,400 units.
Those 2,400 units have to be sent before sales move. At the moment the stock arrives you are still selling 100 units a week, which puts your coverage at 24 weeks on paper. That is twice the target and it looks like a mistake in the controlling report.
The overstock dissolves through the very effect that caused it. Once sales reach 200 units a week, those same 2,400 units are exactly the twelve weeks you wanted.
You have to go in expecting that. The first weeks cost higher storage fees, and those costs amortize through the better media performance. At halved TACoS and doubled sales the return is considerably larger than the additional storage fee.
How we set this up in practice
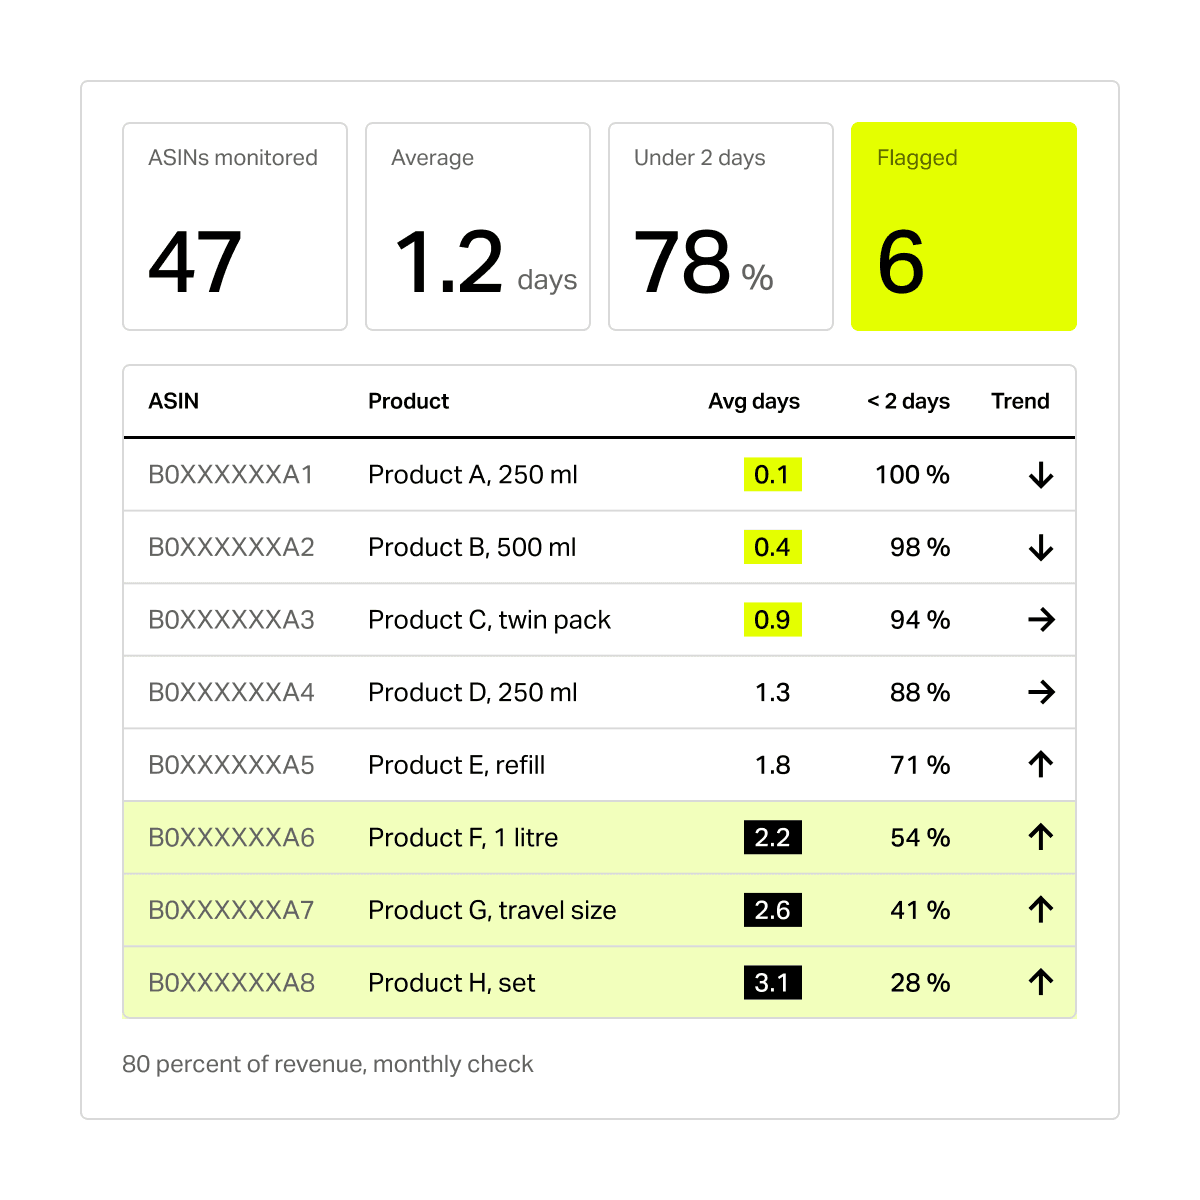
Checking an entire catalogue weekly is not worth it. We split our brand partners' assortment and look at the ASINs carrying 80 percent of revenue. In most catalogues that is between 10 and 15 percent of the items.
For that group, a monthly check runs.
In the starting phase, we check weekly, and there is a specific reason for that. It is the only way to see at what inventory level Amazon actually lowers the delivery promise. That point cannot be predicted from outside, and it differs by ASIN.
Once it is known, you have your minimum level. It belongs in the brand's supply chain planning rather than in a list held by an agency, because only the brand can make sure that level is accounted for in the next production run.
Where the tracking should run
The first level is the individual ASIN, before budget is released. Stock coverage and delivery time are hygiene factors. Check them before signing off a content relaunch or a campaign rebuild. If they are the constraint, the relaunch is money spent on the wrong problem.
The second level is your own top sellers, monitored continuously. That is where the media budget sits, so that is where a delivery problem costs the most. A weekly look is enough to catch drift before it reaches the revenue line.
The third level is the competition's top sellers. This is the offensive use, and the reason tracking beyond your own catalogue pays off.
When a relevant competitor in the same price segment sees its delivery promise climb across several states, its conversion rate falls there with it. The demand remains, it is simply served worse. That is the moment to scale Product Attribute Targeting on their product pages and pick it up.
The window closes again once they replenish. That is why this only works with continuous tracking. Anyone who looks only after noticing something in revenue arrives too late.
What this does not solve
A fast delivery promise does not rescue a weak listing. If the problem sits with the content, the price or the reviews, inventory distribution will not hide it.
The gain also depends on there being demand to capture. This worked because the ASIN already ranked well enough in the regions it could serve to be seen at all. A product nobody finds anywhere does not have a delivery problem.
And replenishment costs. More stock in the network means more capital tied up and higher storage fees, and maximum coverage everywhere is not always the right answer. The map shows you which regions are worth fixing. Without it, you are estimating.
Before the next optimization brief
Open the Search Query Performance report for your most important ASIN. Look at conversion rate by delivery promise on your five strongest search terms and work out what share of your clicks lands in the slowest bucket.
If a gap shows up there, check where your product actually delivers fast and where it does not. The answer takes an afternoon to find and it changes what you spend next quarter's budget on.