In many annual plans, category growth is the main anchor for the brand's own target. That number does not reveal, however, whether it reflects broader buying interest or individual brands whose popularity rises and then fades again.
In the first part of this series, we split revenue into branded and non-branded. In this part, we use travel mugs as an example to show how the Search Query Performance Report and the Product Opportunity Explorer help you work out which share of a category's development your brand can actually reach.
Eleven percent up, then eight percent down
Take travel mugs on Amazon.de as example.
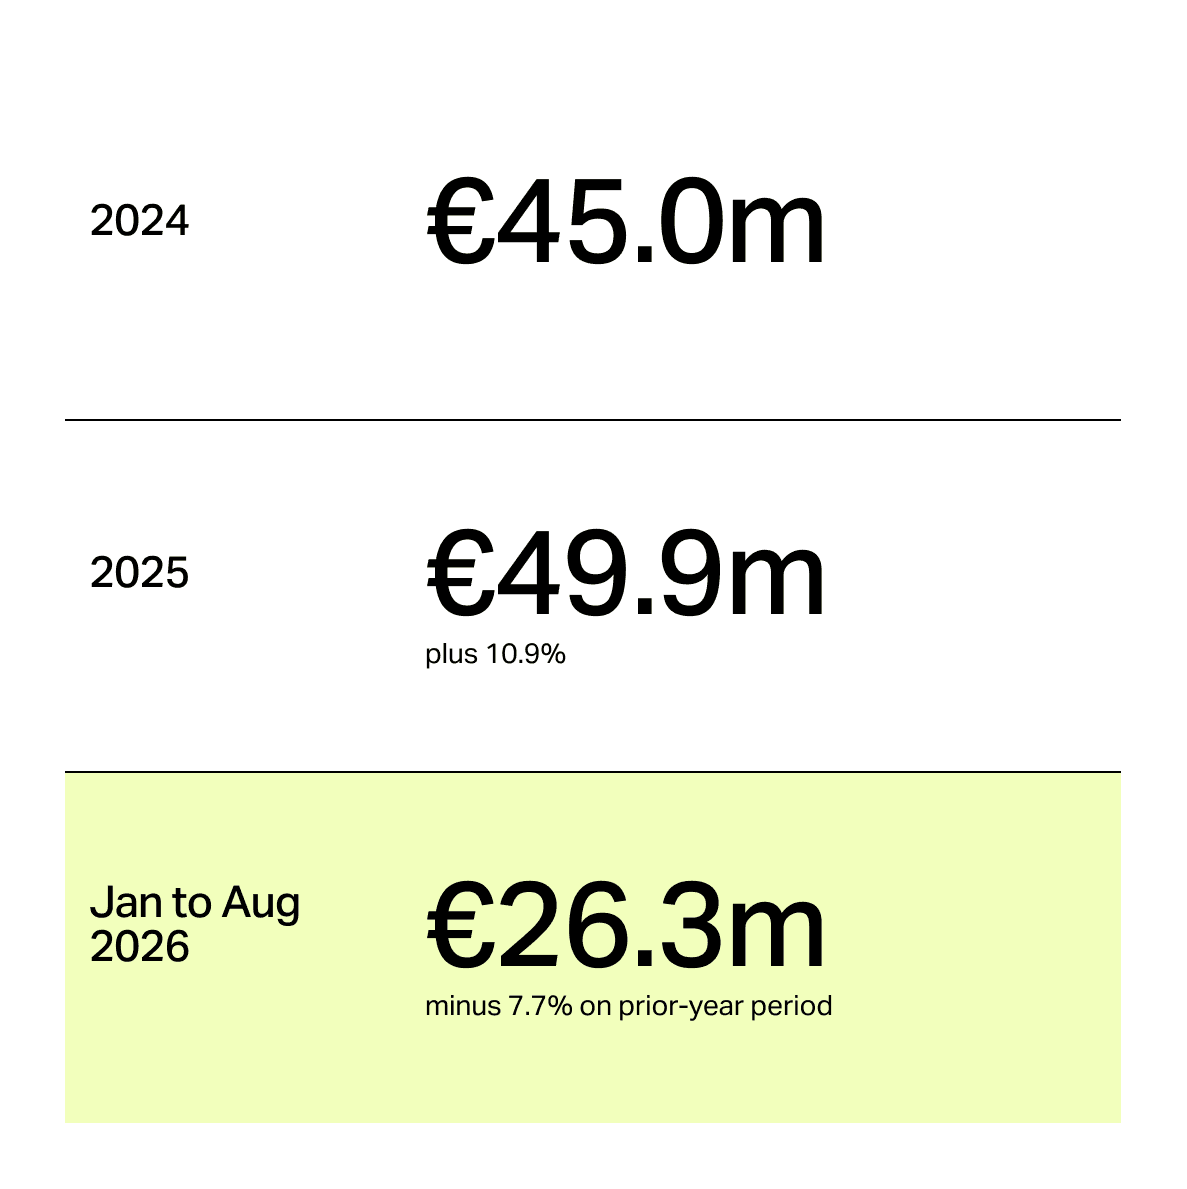
Source: estimates from a market data tool for the travel mug category on Amazon.de.
Anyone planning for 2026 in autumn 2025 had good reason to expect a growing market. Planning for 2027 is now under way, and the same data triggers the opposite reflex. Either the target is set cautiously because the market is shrinking, or an ambitious target is signed off anyway without working out how to reach it in a declining market.
The table deserves a second look. The 2026 figure covers only eight months and cannot simply be extrapolated to the full year, because travel mugs sell far better in autumn and winter than in summer, and the Christmas season is still missing entirely. The only meaningful comparison is with the same period of the previous year.
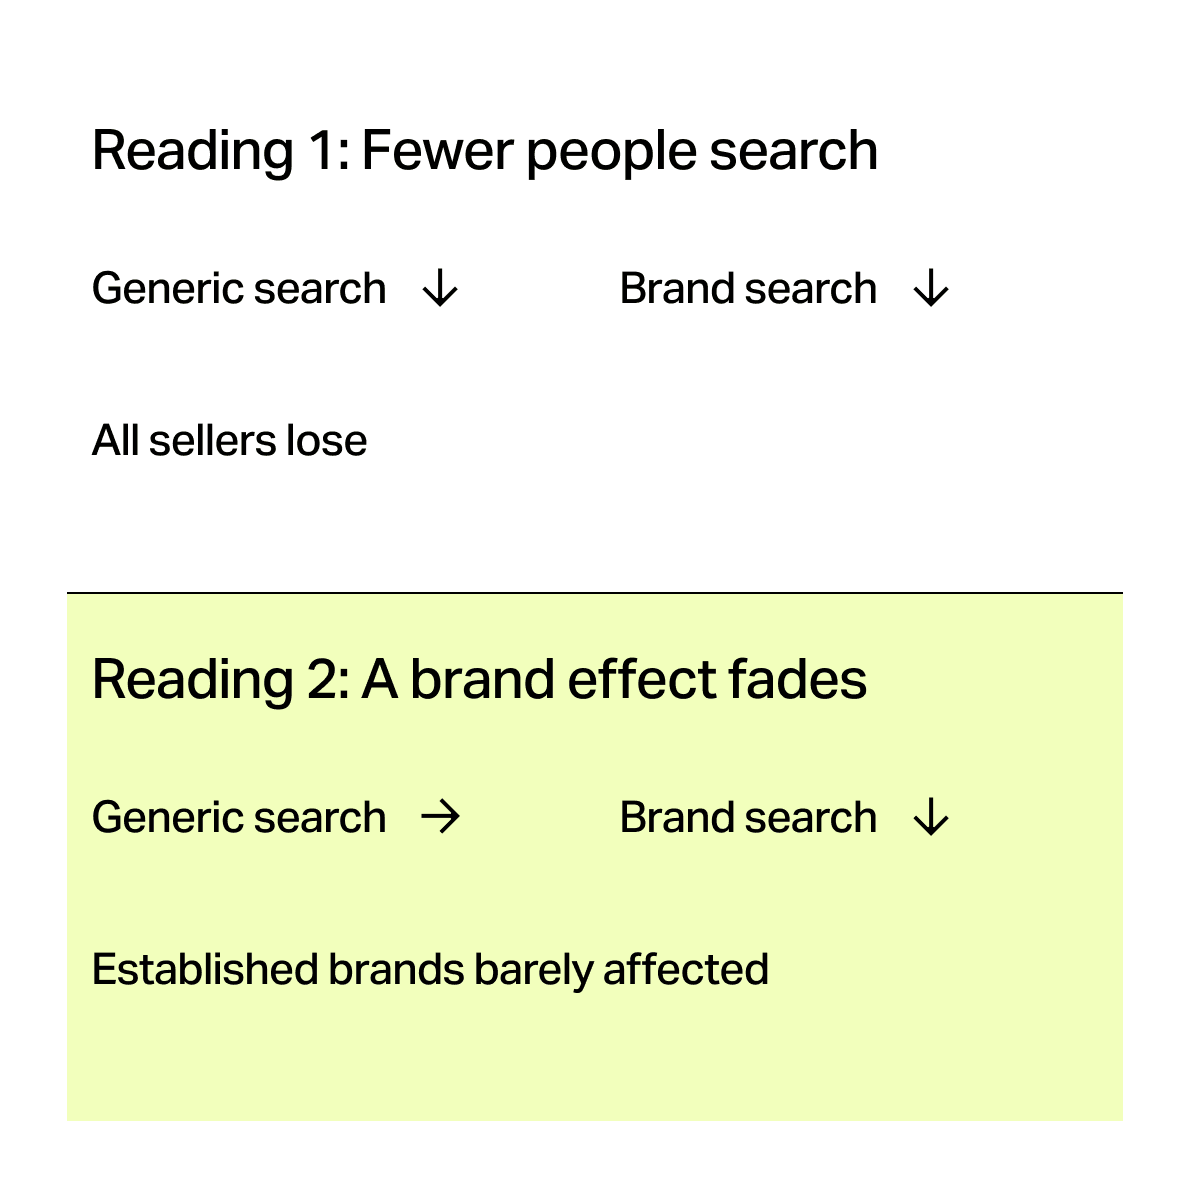
Two readings of the same number
In the first reading, fewer people are simply searching for travel mugs in 2026, and all sellers feel the decline to a similar degree. In the second, a large part of the 2025 growth came from brand searches for individual trend products that became popular on social media, and that effect is now fading while general demand stays stable. For an established brand without a hype of its own, the first reading describes a shrinking market. The second describes a market that barely grew for that brand in 2025 and is barely shrinking for it in 2026.
There is a reason the second reading applies so often. In well-established categories, new competitors rarely rise through generic search terms, because that is where established products with many reviews and strong rankings sit. They grow through brand building and influencer marketing, and their customers search for them by name on Amazon. This revenue comes in from outside and can disappear just as quickly.
Two tools, two perspectives
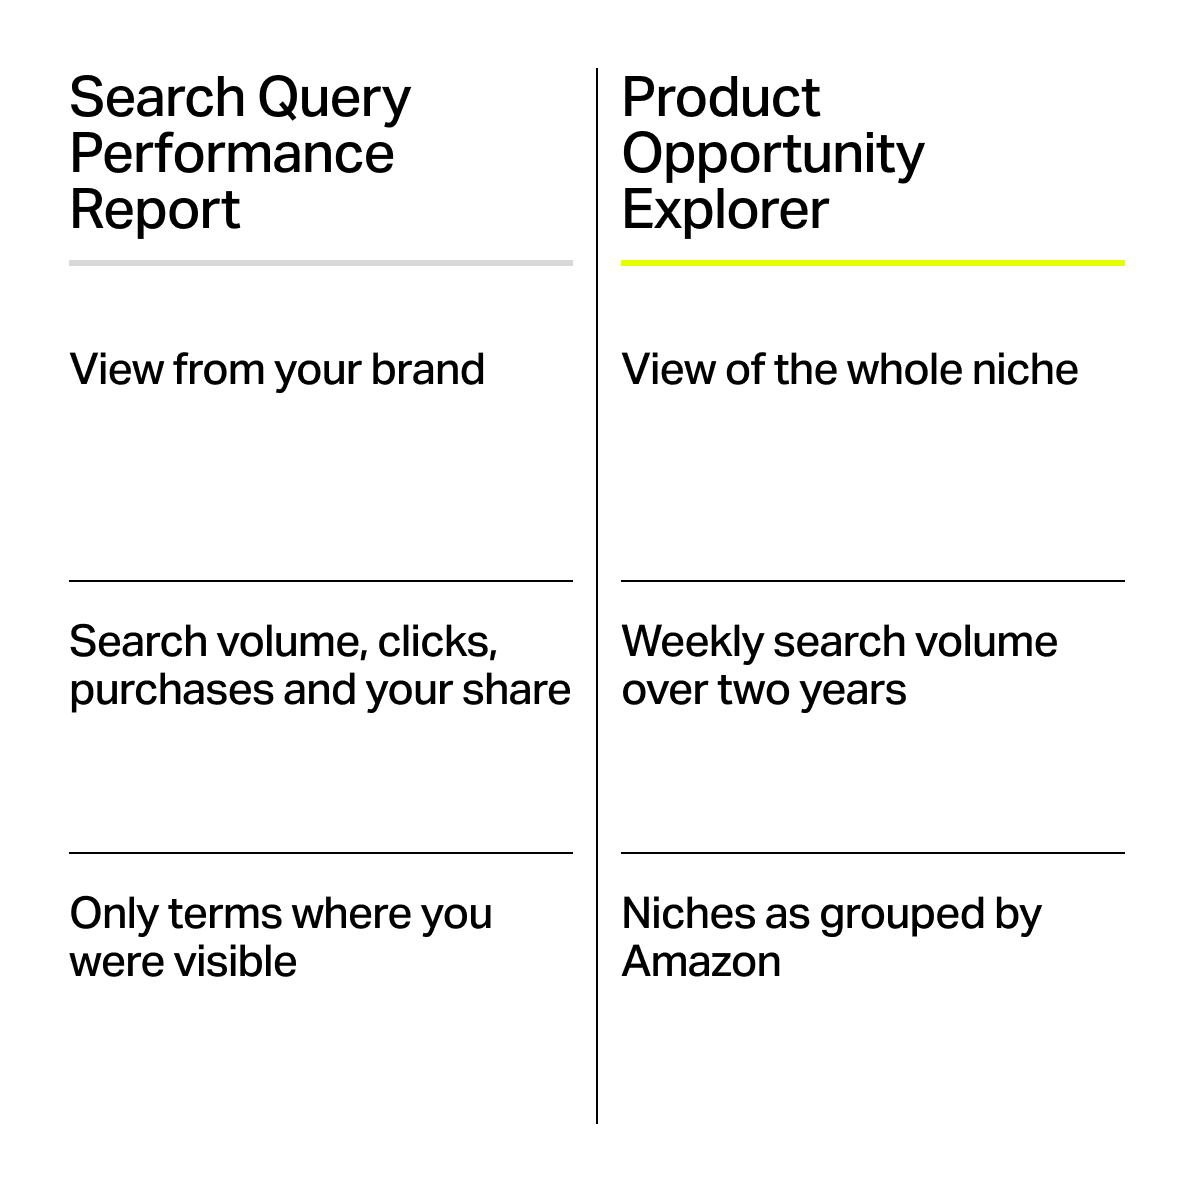
Amazon itself provides two tools that help you tell the readings apart. The Search Query Performance Report in Brand Analytics shows, for each search term, the total search volume along with impressions, clicks and purchases, both for the market as a whole and for your own brand. From this you can read your click share and purchase share. The report only covers search terms where your brand was actually shown.
The Product Opportunity Explorer works one level higher. Amazon groups search terms that reflect the same customer need into niches. For each niche, the tool shows search volume week by week over two years and the conversion rate of the search, regardless of whether your brand is visible there. The niche search also lets you export a list of related niches with their three most important search terms.
What the data shows for travel mugs
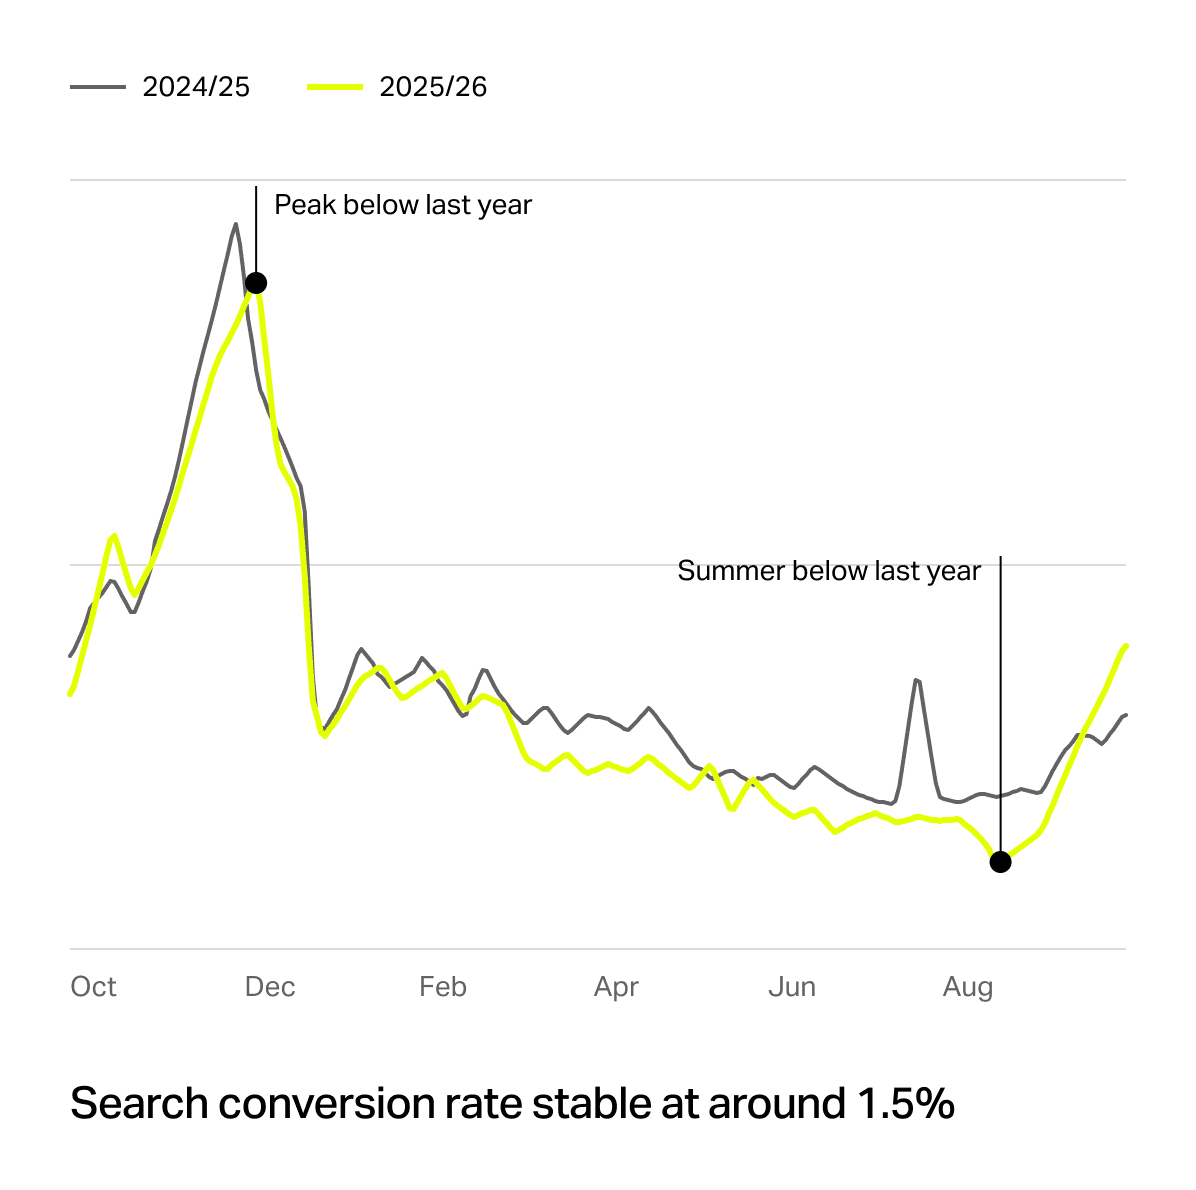
In the "Thermobecher" niche, weekly search volume follows the same pattern in both years, with a peak in December and a low in summer. The peak at the end of 2025 was lower than the one at the end of 2024, however, and the summer weeks of 2026 were noticeably below those of 2025. The conversion rate of the search stayed almost unchanged at around 1.5 percent. Part of the decline really does come from fewer general searches.
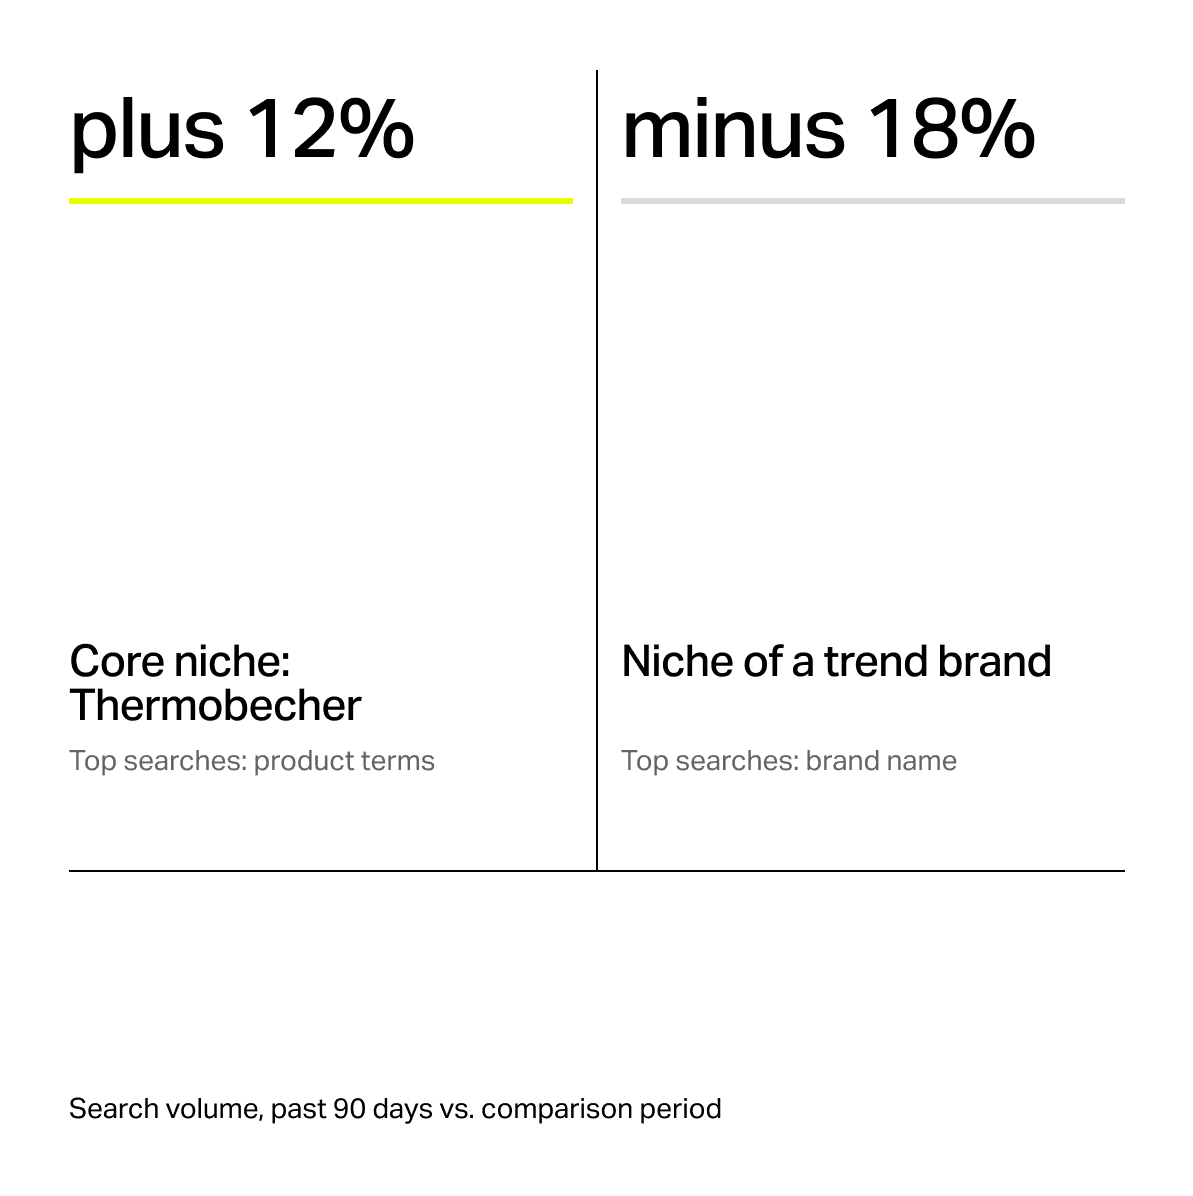
The niche export provides the other half of the answer. In several niches, the most searched terms consist entirely of brand names. In the niche for travel mugs with a handle, all three are searches for the products of a single trend brand. Search volume there was 18 percent lower over the past 90 days than in the comparison period, while the core niche grew by 12 percent over the same window. Another part of the decline therefore comes from a fading brand effect. For travel mugs, the answer is a mix of both readings, as it is in most categories we look at.
Two pitfalls in the analysis
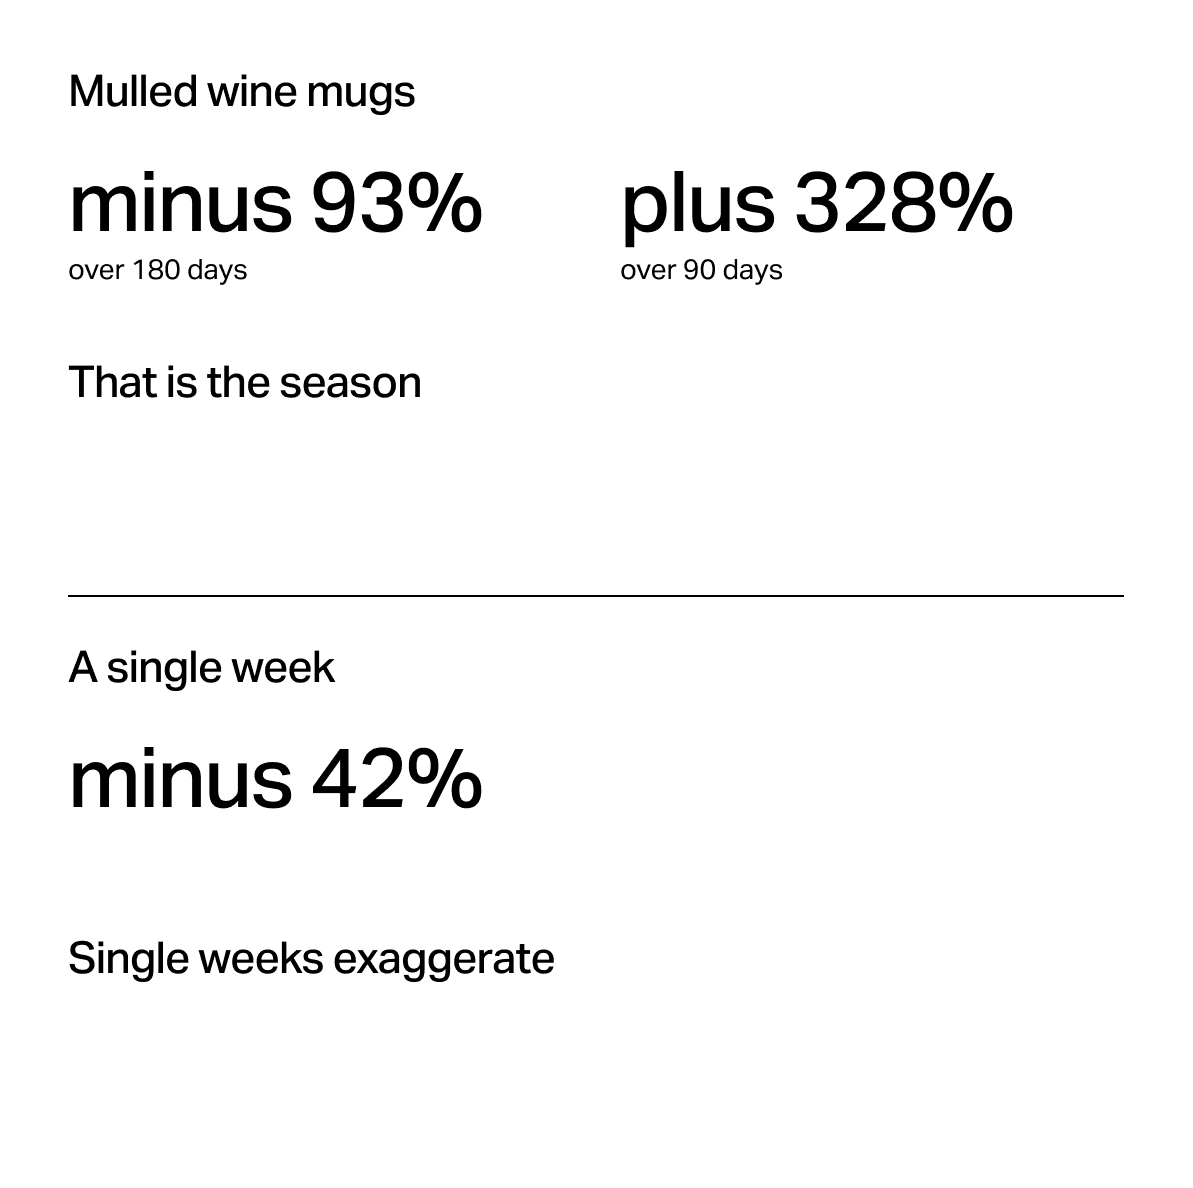
For seasonal products, growth figures over 90 or 180 days mostly reflect the season. In the same export, the niche for mulled wine mugs shows minus 93 percent over 180 days and plus 328 percent over 90 days. Figures like these are meaningful when you compare niches with each other or against the same weeks of the previous year.
Single weeks call for similar caution. In the niche overview, search volume for the current week is 123,633, compared with 211,713 a year earlier. That is a drop of 42 percent, far steeper than the decline the full-year curve shows.
What the data cannot do
Market data tools estimate category revenue from rankings and samples, and the uncertainty grows as the category gets smaller. The niches in the Product Opportunity Explorer are groupings defined by Amazon, which do not always match your own view of the category, and individual search terms can appear in several niches.
What you can do this week
Export the niches for your category from the Product Opportunity Explorer and mark which of them are shaped by brand names. Then use the Search Query Performance Report to compare the search volume of your five most important generic search terms with the same weeks of the previous year. That tells you how much tailwind the market will really give you in 2027.
In part three, we turn this into a growth target step by step, all the way to the media budget it requires.