
A growth target becomes a plan once three numbers are settled: what the brand contributes on its own, what the market delivers and how big the gap is that the Amazon account has to close.
In the first two parts of this series, we split revenue into branded and non-branded and showed how to read your category's development properly. This final part brings both together and works through a target of plus 30 percent step by step, all the way to the media budget it requires.
The starting point
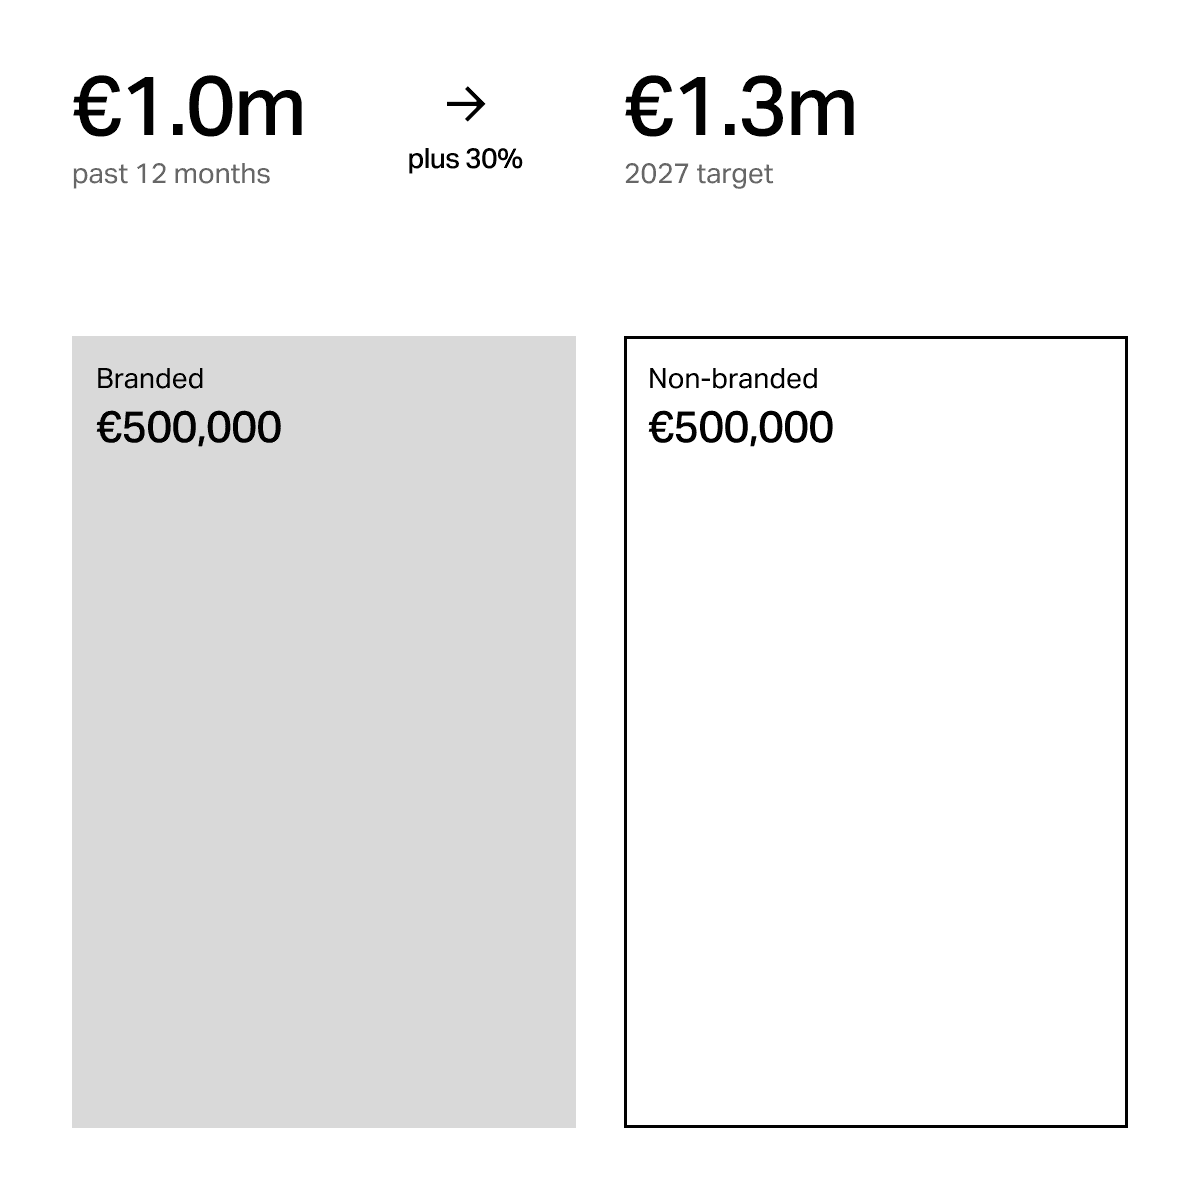
For the calculation, we take an established travel mug brand with €1.0 million in Amazon revenue over the past twelve months. Half of it is branded revenue, the other half non-branded. The target for 2027 is plus 30 percent, which means €300,000 in additional revenue. The numbers are a simplified example that makes the logic easy to follow.
As a reminder, here is the formula from part one: revenue results from search volume, click share, conversion rate and average selling price.
For branded revenue, marketing is what mainly moves search volume. For non-branded revenue, the market sets the search volume and the account determines how much of it you win.
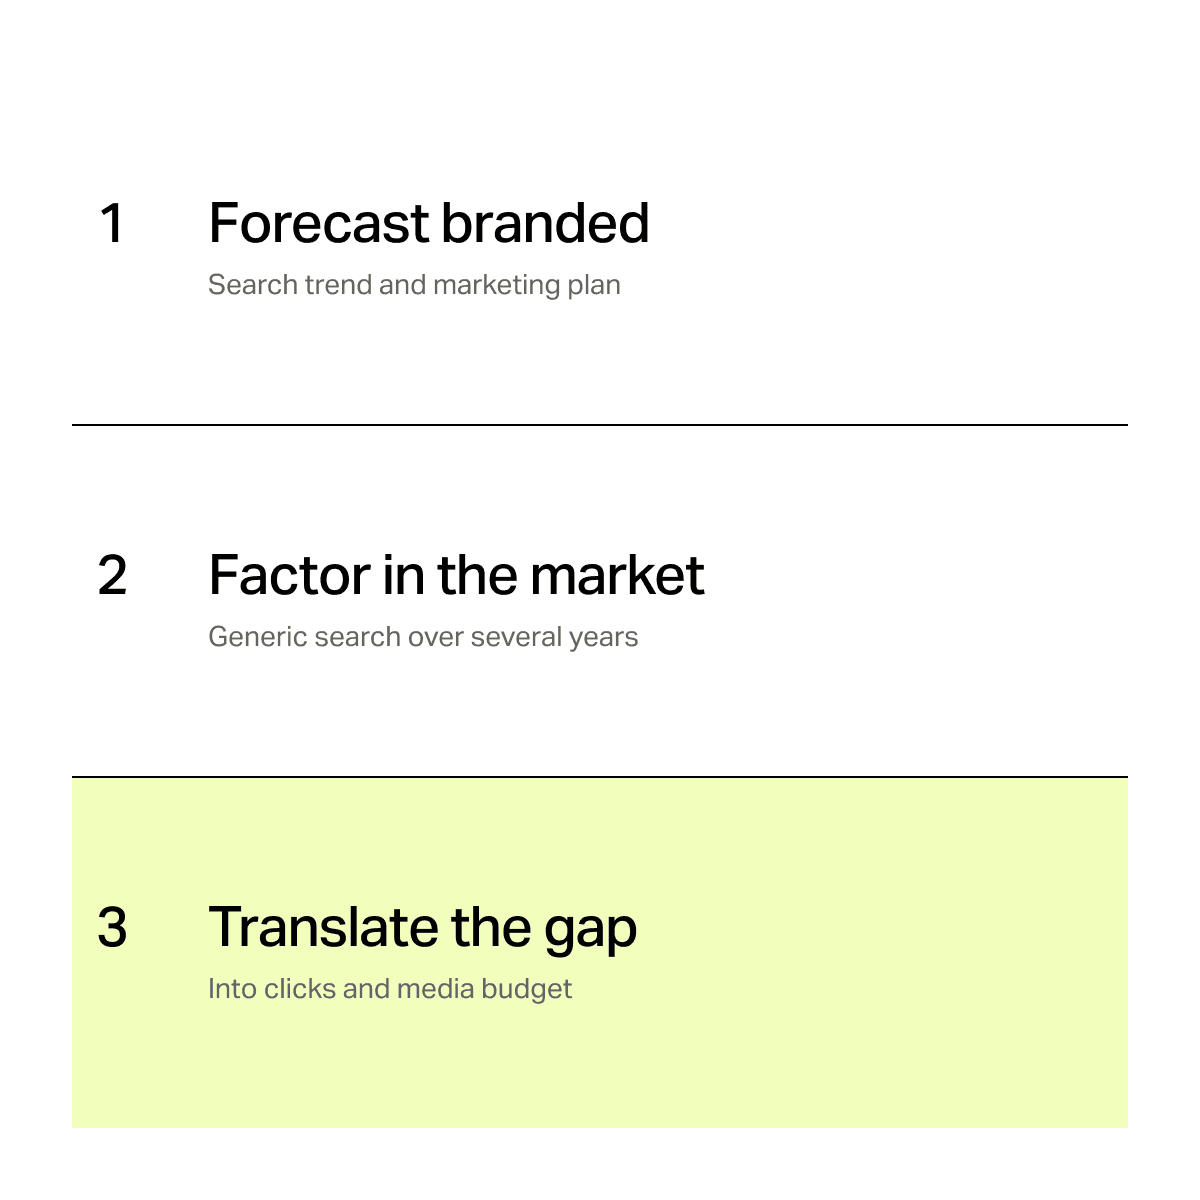
Step 1: Forecast branded revenue
The starting point is the search volume for your brand terms over the past twelve months, compared with the period before. If it grew by 15 percent, that is your first orientation. Next comes the conversation with the marketing and brand team. Which campaigns, influencer activities or product launches are planned for 2027, and will investment in awareness go up or down compared with this year?
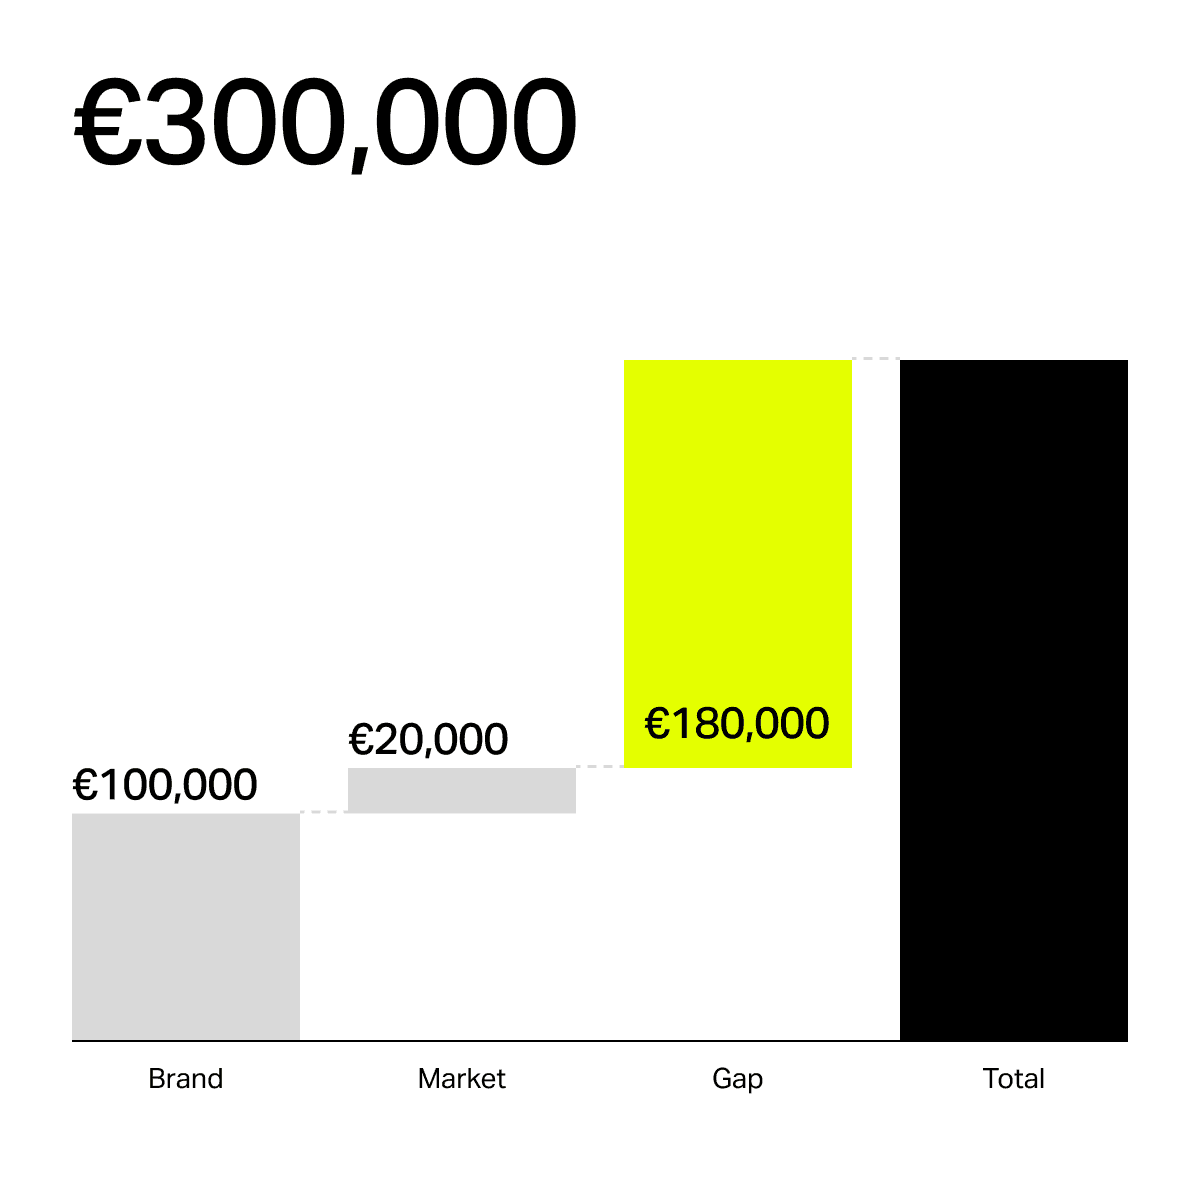
In our example, last year's trend and the marketing plan together point to expected growth in brand searches of 20 percent. On €500,000 of branded revenue, that amounts to €100,000.
Step 2: Factor in market development on the generic side
For non-branded revenue, look at how generic search volume for your most important search terms has developed over several years, using the tools and keeping in mind the pitfalls from part two. If it has grown steadily by around 4 percent a year, you can carry that rate forward, as long as your click share stays the same. If generic searches are declining, as they recently have for travel mugs, that decline belongs in the calculation, and the gap in step 3 grows accordingly.
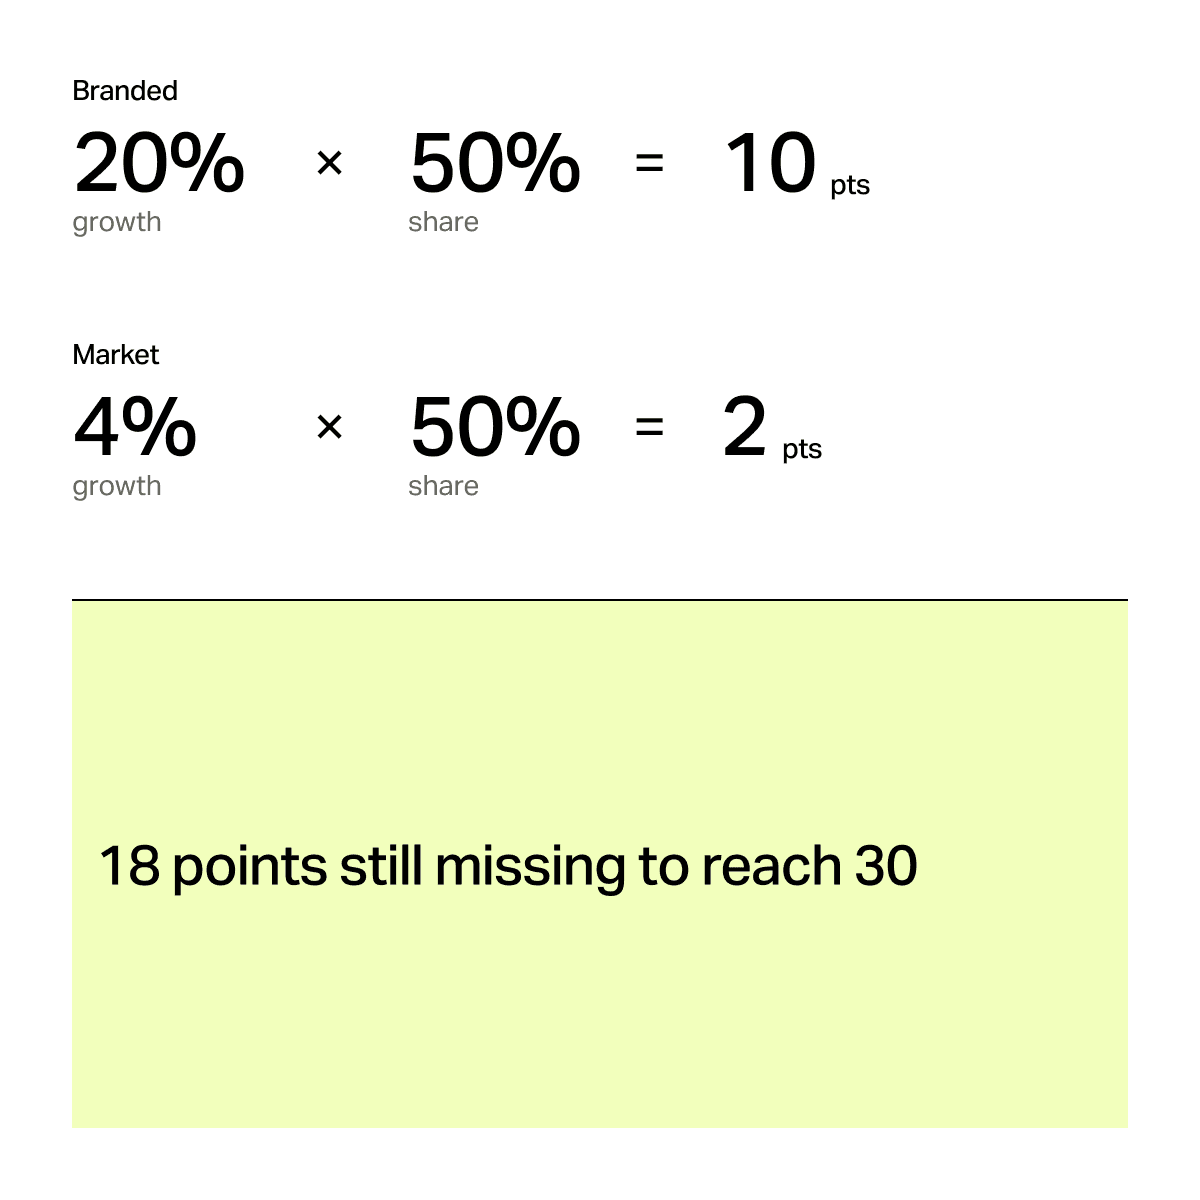
On €500,000 of non-branded revenue, 4 percent means an increase of €20,000. This is where planning meetings most often get the maths wrong. Growth rates of individual branches can only be added up once you weight them by their share of revenue. Four percent growth on half of the revenue adds 2 percentage points to total growth, and the 20 percent on the branded side from step 1 adds 10 percentage points.
Step 3: Translate the gap into clicks and budget
After the first two steps, €120,000 of the target is accounted for. The account has to win the remaining €180,000 on its own. The obvious route is a higher click share on generic searches, and to get there you run the formula backwards.
At an average selling price of €30, €180,000 equals exactly 6,000 units sold. At a conversion rate of 12 percent, that requires 50,000 additional clicks. If a click costs €0.90 on average, the result is around €45,000 in additional media budget for the year.
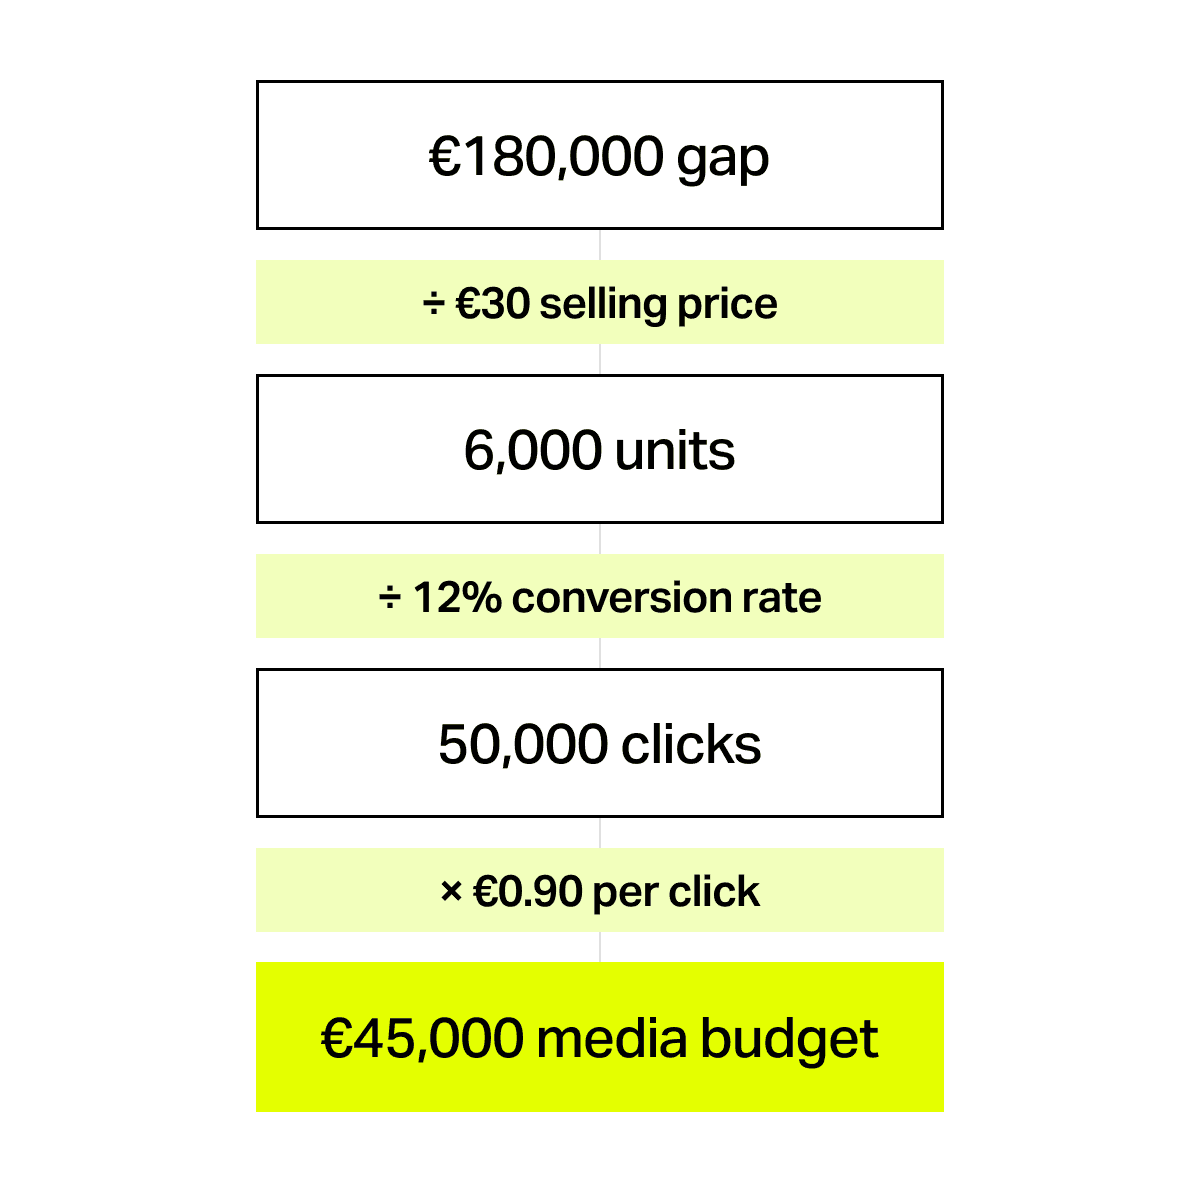
The effect unfolds in two stages. First, you buy the additional visibility through advertising. The extra sales then improve your organic rankings, so that over time some of the clicks come without ad spend. This sequence belongs on the table in the planning meeting, because the budget is due before the organic effect kicks in.
More budget is one lever among several
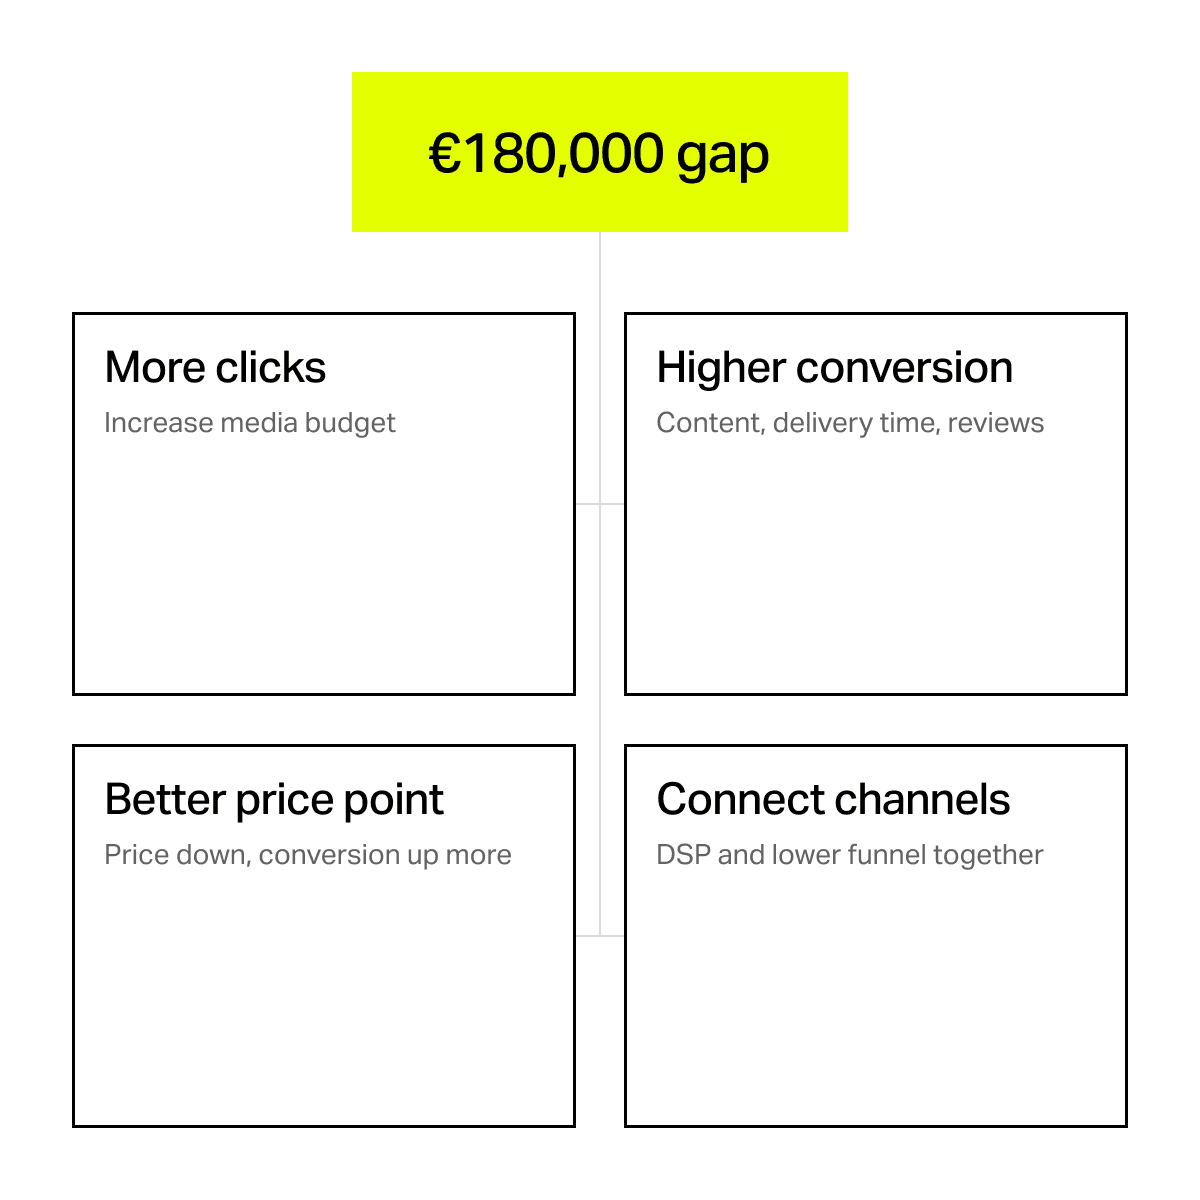
The backward calculation assumes that conversion rate and selling price stay the same. Both can be moved as well, and that is often cheaper than buying additional clicks. The formula shows why: every link in the chain has the same weight in the revenue it produces.
The first route runs through the conversion rate. Better product images and copy, faster delivery, or more and better reviews make a larger share of those who click go on to buy. If the conversion rate in our example rises from 12 to 13.2 percent, an increase of one tenth, the 6,000 units only need around 45,500 clicks, and the budget drops to roughly €41,000.
The second route runs through price. A lower price point reduces the average selling price but can lift the conversion rate disproportionately. If the price falls by 10 percent and the conversion rate rises by 20 percent as a result, revenue grows by 8 percent with the same number of clicks. Whether this also pays off on the bottom line depends on the margin, which is why contribution margin always belongs in the calculation alongside revenue.
The third route runs through the interplay between channels. With Amazon DSP, you reach people further up the funnel and bring back visitors who have already seen a product page. At best, this raises the click-through and conversion rates of your lower-funnel ads and improves the efficiency of the entire media budget.
In practice, the gap is rarely closed through a single lever. That is why every route belongs in the 2027 planning workshop, each with the question of what it can realistically contribute, what it costs and who in the company is responsible for it.
What this means for the budget decision
This breakdown changes the conversation in annual planning. The question becomes which combination of budget, conversion rate and price you want to use to win the €180,000, and whether marketing will actually deliver the assumed 20 percent on the branded side. Both can be checked, and both can be assigned to someone who owns them.
If the brand team plans less awareness for 2027, the calculation shifts immediately. The gap on the generic side grows, and the required budget grows with it. Whoever sees this before the year starts can adjust the target or release the budget. Whoever sees it in the third quarter ends up explaining a missed target.
How the plan stays alive during the year
The calculation needs a fixed set of metrics: search volume for brand terms, generic search volume for core terms and niches, click share and purchase share, conversion rate, average selling price, the share of new-to-brand customers and TACoS (ad spend relative to total revenue) as a check on profitability. Add the brand team's marketing calendar to that.
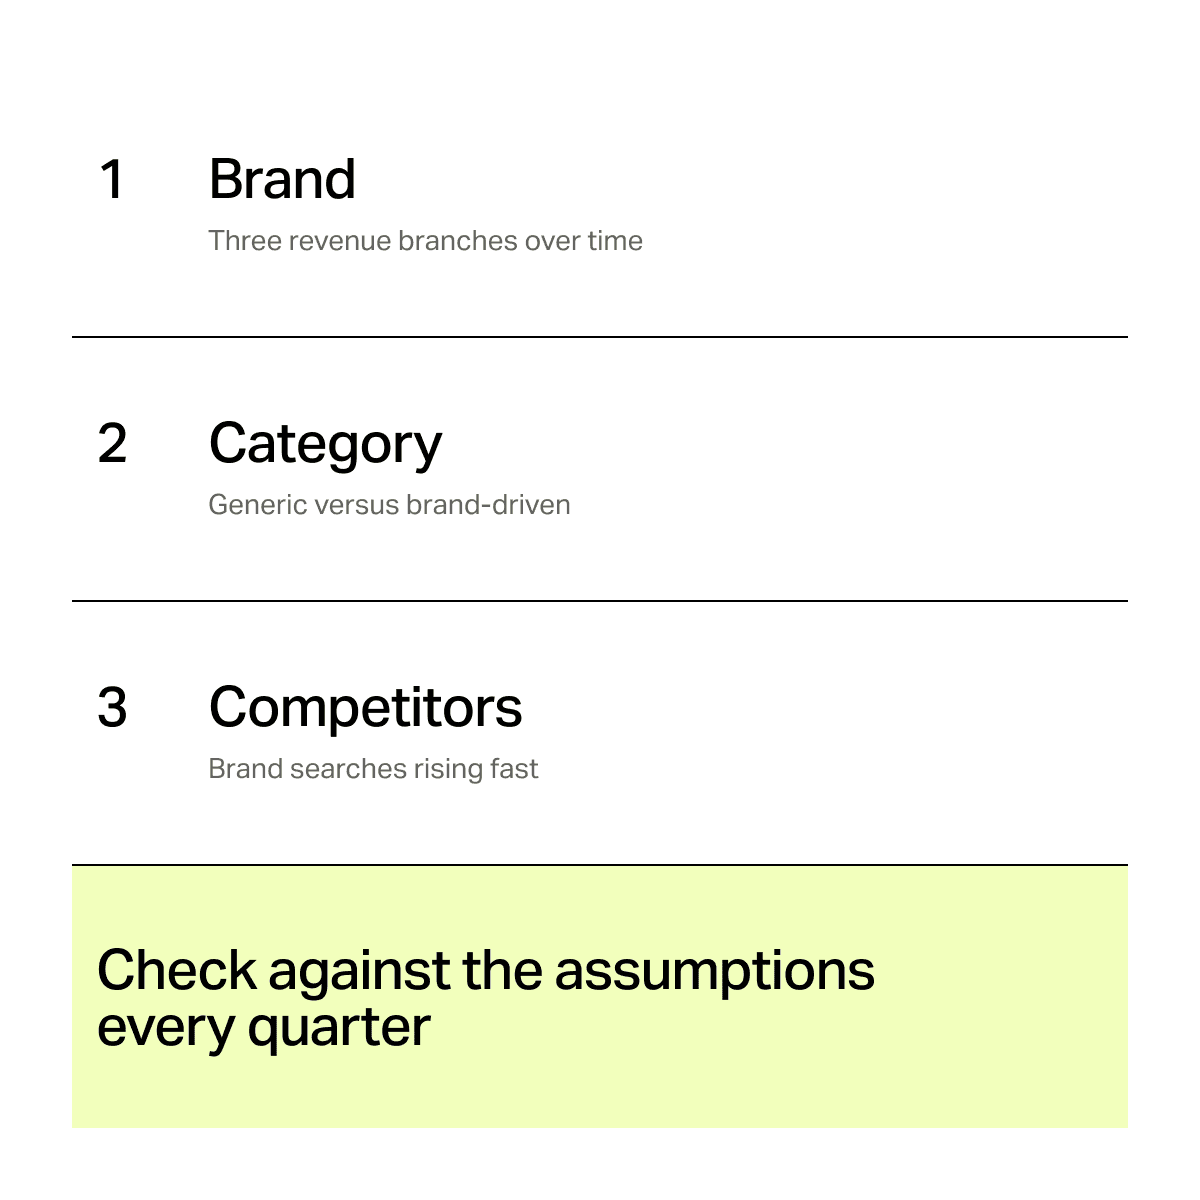
A view across three levels has proven its worth: your own brand with its three revenue branches, the category with its split between generic and brand-driven growth, and competitors whose brand searches are rising quickly. For the clients we set up annual planning with, we review these three levels every quarter and compare the assumptions with actual figures.
What the method cannot do
The forecast for branded revenue is only as good as the information from marketing, and changes to campaign plans during the year cannot be foreseen in the autumn. The calculation also assumes a constant conversion rate and a constant cost per click. In reality, additional clicks often get more expensive as you scale, because you push into less relevant search terms or weaker placements. The €45,000 is therefore a lower bound.
What you can do this week
Take your growth target for 2027 and fill in the three steps with your own numbers: the branded forecast from search trend and marketing plan, the market development on the generic side and the remaining gap, translated into clicks and budget. Alongside that, collect the levers that can shrink the gap beyond additional budget.
Take this page into your next planning meeting, and you will put a plan on the table whose assumptions can be checked and discussed one by one.