
Amazon has quietly become the cheapest market research a brand will ever buy. Most brands still use it as a shelf rather than as a measuring instrument, and the two mistakes that follow are expensive ones.
There is an older way of entering a new country, and most brands still do it. You find a distributor or negotiate with a national chain. The buyer takes a slice of your catalogue, usually the products that sell best at home, because that is the only evidence in the room. Stock ships, listings go live, and then everyone waits for the sell-through report. Eighteen months later you learn which products worked. Whether that had anything to do with the products themselves is impossible to say, because by then placement, promotion, seasonality and a dozen other variables have tangled themselves together.
Amazon changes the economics of that experiment. Before you commit stock to anyone, the marketplace has already recorded what people in that country actually bought, at what price, from which brands, in what volume. You can read all of it without asking a single buyer for a meeting. And when you do eventually sit down with a retail partner twelve months later, you arrive with performance data from their market rather than a catalogue and an argument.
That is the opportunity. The trap is that reading the data is not the same as reading it correctly, and we see the same two errors often enough that they are worth naming before anything else.
The first mistake: assuming your bestsellers travel
A brand decides on the UK. Someone pulls the German sales report, sorts by revenue, and the top twenty products become the launch range. It feels like the rigorous choice, and in fairness it is the only evidence anyone has on hand.
The trouble is what that home revenue is actually measuring. Some of it reflects genuine product quality, the kind that travels. The rest reflects brand recall, established retail presence, a decade of advertising and the simple fact that shoppers search for you by name. None of that crosses the border with your pallets. In the new market every search is generic, and the person typing it has never heard of you.
Rank your expansion assortment by home revenue and you quietly import an advantage that does not exist where you are going.
The second mistake: the category fits and you still cannot get in
The smarter version of the same error is harder to spot, and it costs more.
This brand does the work. It checks where its price point lands, identifies a category with real demand in the target market, confirms the price band matches, and commits. Everything about that analysis looks correct. Market size, confirmed. Price fit, confirmed.
Then it launches, spends a year on advertising, and gradually discovers that the revenue in that category belongs to two or three brands who have owned it for a decade. Shoppers in that segment are not browsing and comparing. They are typing a brand name into the search bar and buying the first result.
Nobody asked whether a brand with no reputation could realistically get in. That question has an answer, and the answer sits in the same export everyone already downloaded.
Working through it properly is the difference between a launch plan and a hypothesis nobody tested. It is also, frankly, why brands end up working with us on this rather than doing it in-house, even though nothing in the method is secret. What follows is the whole thing, run end to end on a real market.
The worked example: German and UK toys
Two exports, both gross merchandise value for 2025. Every product in the Toys category on Amazon Germany and Amazon UK, with revenue, units, price, brand and review counts. Roughly nine thousand products per market once the electronics and school supplies that Amazon files under "toys" have been stripped out, which in the German case was a surprising 22% of the raw export.
The headline numbers first. Germany comes in at €1,650m, which converts to £1,412m at the rate we used throughout, against £1,070m for the UK. That makes Germany the larger toy marketplace by about a third. A German toy brand looking at Britain is therefore looking at a smaller market, which is both expected and unremarkable. Everything interesting is in the shape rather than the size.
Step one: use your home data for price, and nothing else
Start with the full product export from your own marketplace account. It answers two questions: what you can actually supply, and what price band you operate in. We take the 25th to 75th percentile of list prices and treat that as the brand's working range.
Then set the revenue column aside and do not look at it again until the end. Home revenue is a supply map. The moment it becomes a ranking, mistake one has happened.
Step two: let the destination market define the categories
Pull a broad category export from the target marketplace and classify it by product title, using rules explicit enough that you could hand them to a colleague and get the same result.
Then apply exactly those rules to your home market. This sounds pedantic until you skip it. Build one side from your internal product hierarchy and the other from Amazon's taxonomy, and you end up comparing two things that look alike and are not, which produces a comparison that is worse than useless because it looks credible.
Step three: compare the shape of the two markets
With both sides classified identically, segment shares become comparable. We use a simple index: UK share of revenue divided by German share, multiplied by a hundred. Anything above a hundred carries more weight in the UK than it does at home.
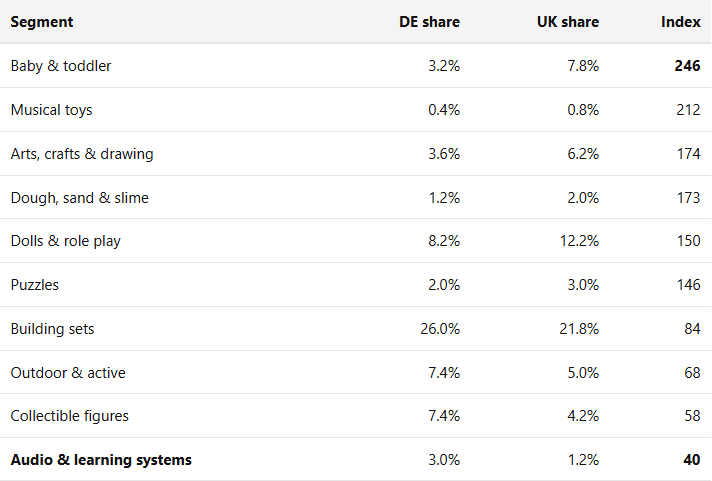
The bottom row is the one worth pausing on. Audio and learning systems, which in Germany means Tonies and the ecosystem around it, carries two and a half times more relative weight at home than in the UK. The explanation is sitting in the same data: one German brand holds around 57% of that segment in both countries, but the British segment is a third of the size. Germany invented this category and the UK has only partly adopted it. A German brand expanding audio toys into Britain would be building on ground that looks familiar and is considerably thinner.
Baby and toddler runs in the opposite direction with an index of 246. Relative to market size, British parents spend two and a half times as much there as German ones.
Neither of those facts is visible in a German sales report, and neither would come up in a conversation with a UK distributor, who has no particular reason to tell you.
Step three and a half: size it properly with TAM, SAM and SOM
Before going further it is worth being precise about what is being measured, because "market size" covers three quite different things and brands routinely quote the largest of them.
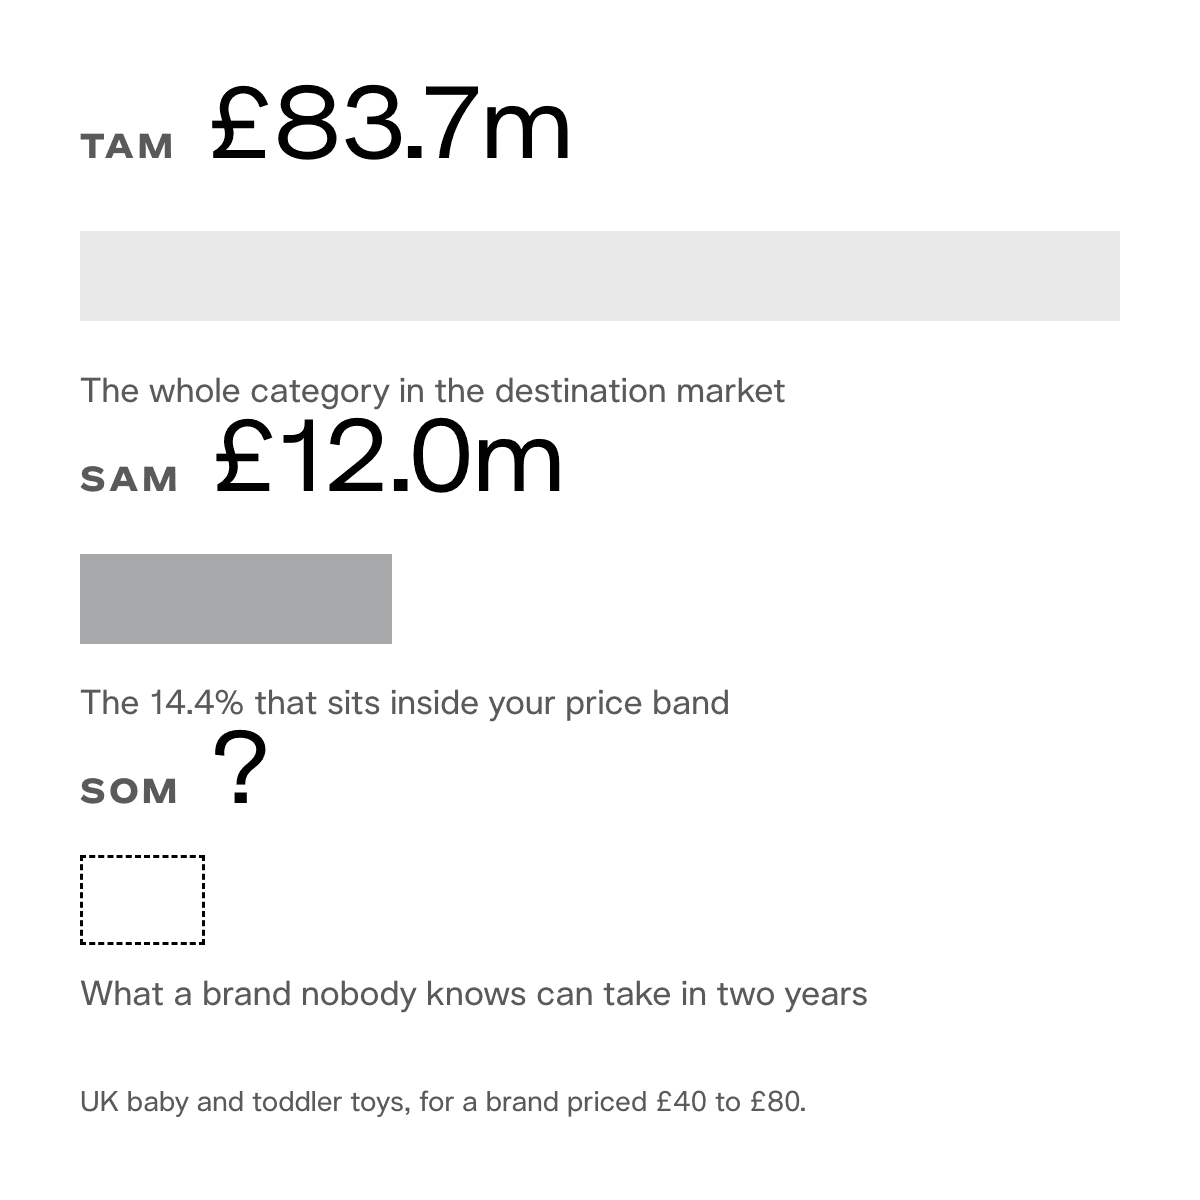
TAM, the total addressable market, is the whole segment in the destination country. UK baby and toddler toys came to £83.7m in 2025. That is the number that ends up in board presentations, and on its own it is close to meaningless for a specific brand.
SAM, the serviceable addressable market, is the share of that revenue falling inside your own price band, which is where step one finally earns its keep. A premium manufacturer working between £40 and £80 finds that 14.4% of baby and toddler revenue sits in that range, so the SAM is £12.0m. A product priced outside where a market spends its money cannot capture that money however good it is, and a surprising number of expansion cases fall apart at exactly this line.
SOM, the serviceable obtainable market, is what a brand with no local recognition can realistically take within roughly two years. Most models set this by judgement, usually somewhere around two per cent because that sounds reasonable. We derive it instead from how open the segment actually is, which is step four.
The comparison with building sets makes the point better than any amount of explanation. Premium building sets between £40 and £80 carry a SAM of £59.0m, five times larger than baby and toddler. On TAM and SAM alone it is the obvious choice. It is also the segment where LEGO holds 89% of that exact price band, which no amount of market sizing will tell you.
Step four: ask whether you can actually get in
Here is where most analyses stop, one question too early, and where the second mistake gets made.
Market size tells you where the money is. It says nothing about whether any of that money is available to a brand nobody has heard of. Three measurements answer that, and all three are already in the export you downloaded.
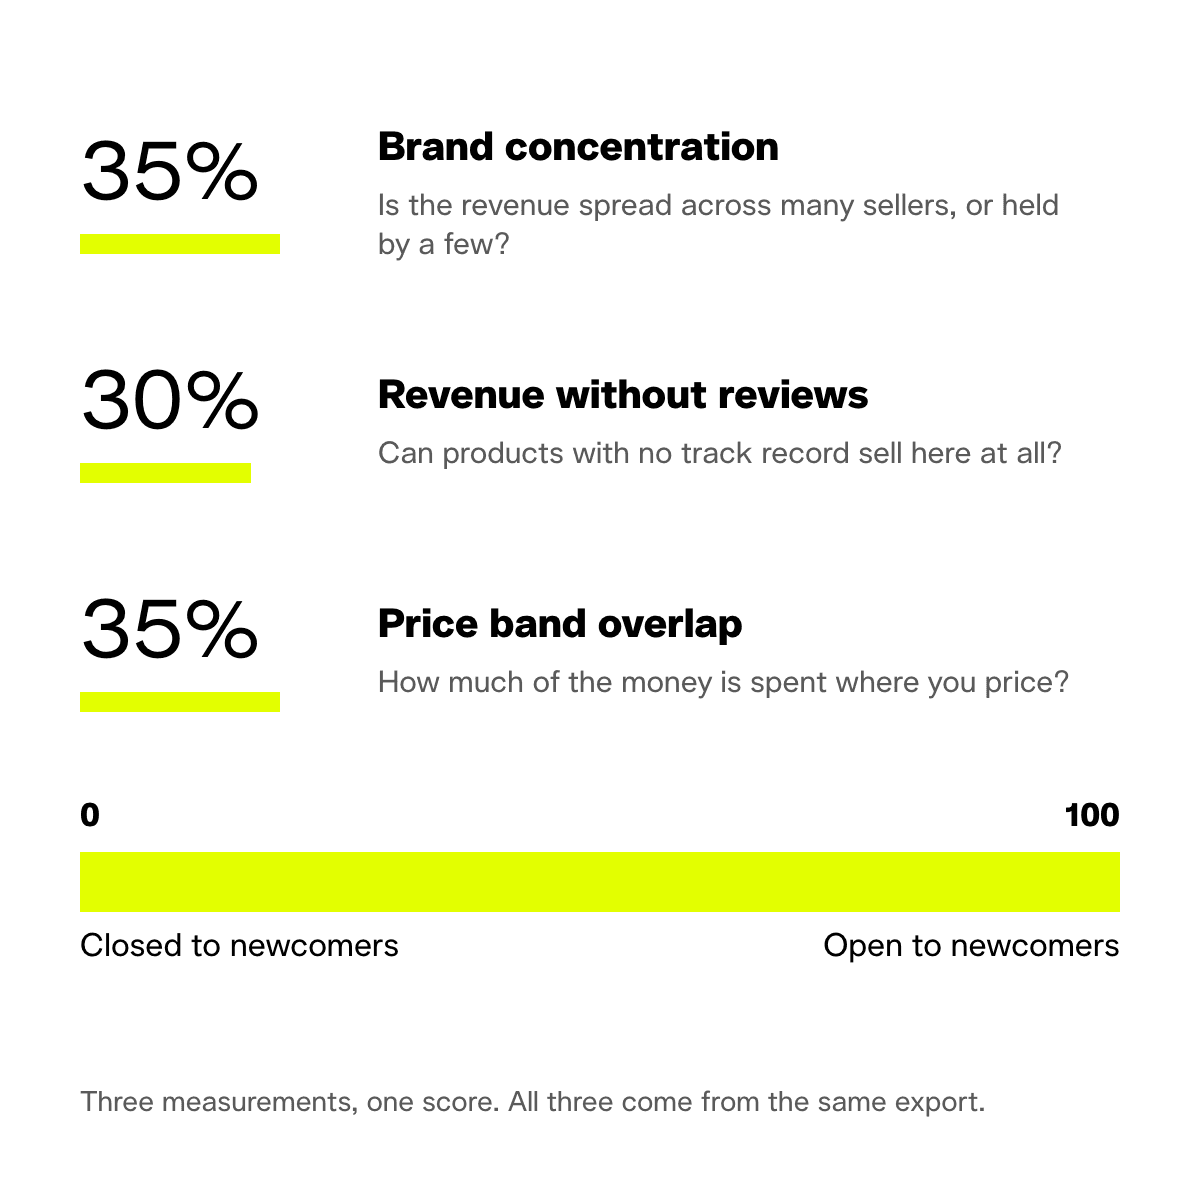
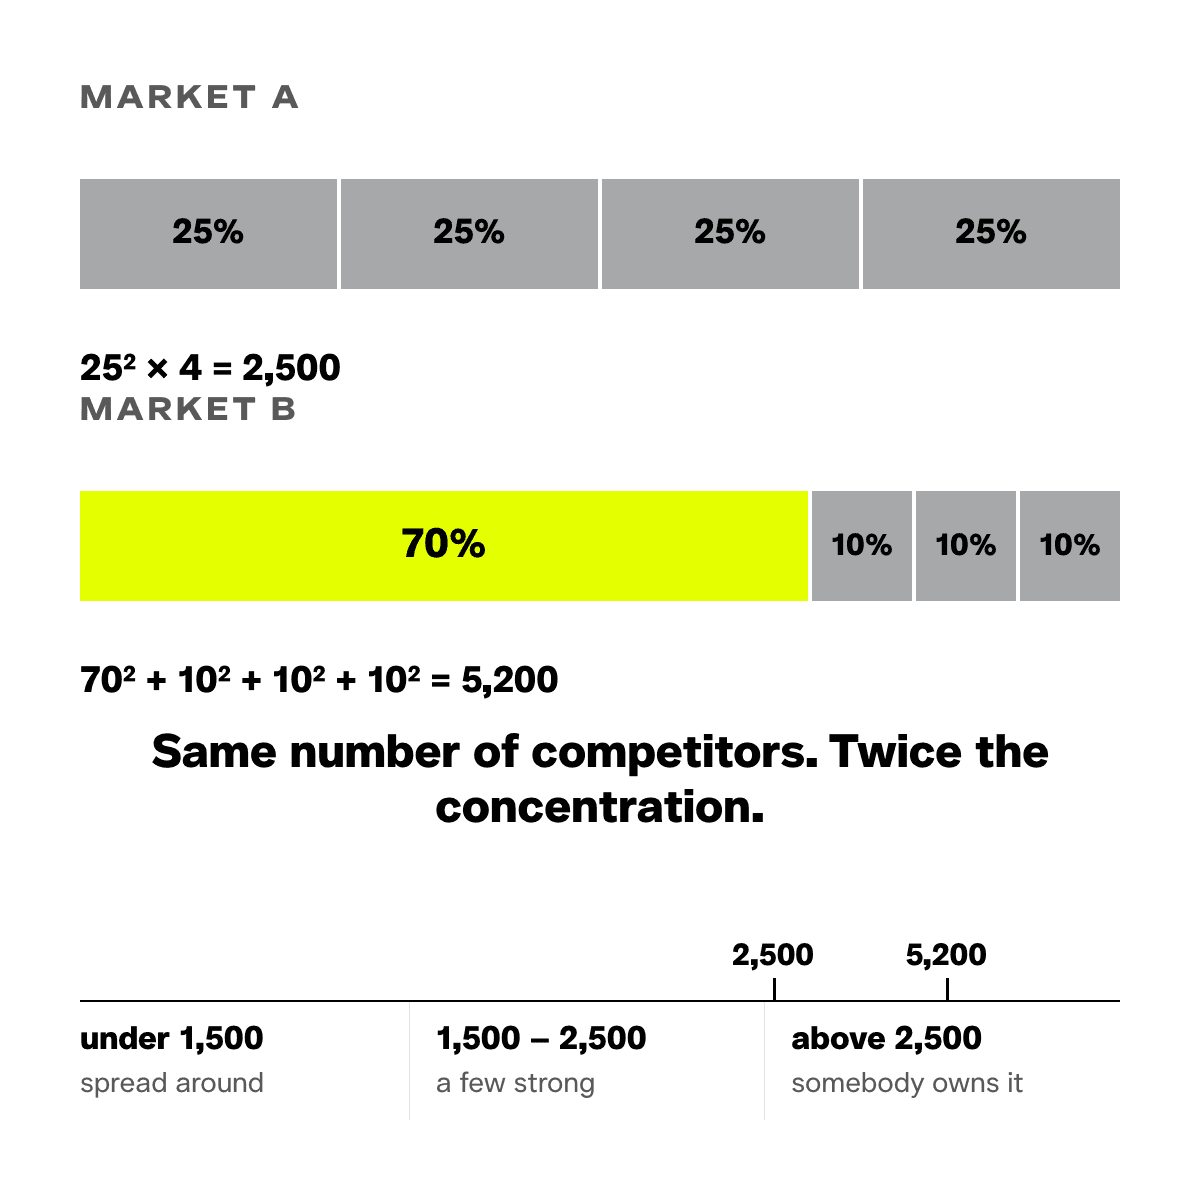
Brand concentration. Take each brand's share of the segment, square it, and add the results together. The squaring is the point, because it makes a dominant player count far more heavily than several mid-sized ones. Four brands at 25% each produces 2,500. One brand at 70% with three at 10% produces 5,200. Identical number of competitors, twice the concentration. Below 1,500 the revenue is genuinely spread around; above 2,500 somebody owns the place.
Revenue going to products without established reviews. This measures how much of a segment's money flows to listings that have not yet built social proof. If half the revenue sits with low-review products, newcomers are visibly getting through. If it is a quarter, the money sits with incumbents and shows no sign of moving.
Price band overlap. How much of the segment's revenue falls inside your own price range, which is where step one finally earns its keep.
Run those across the UK toy market above £40, roughly where a premium manufacturer operates, and the picture pulls apart sharply.
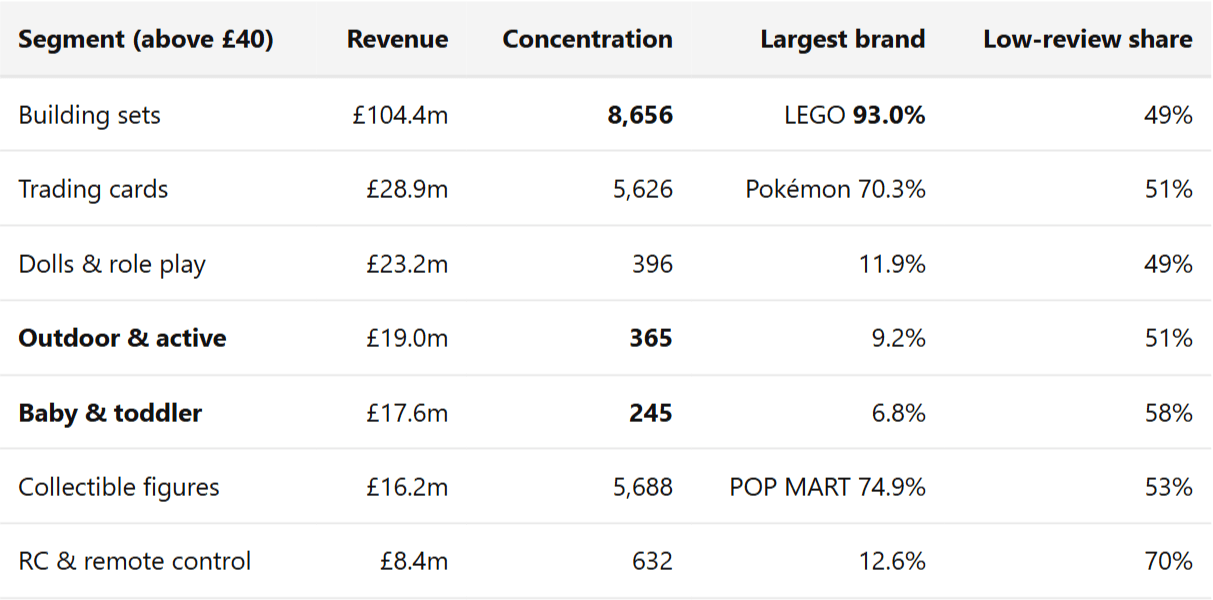
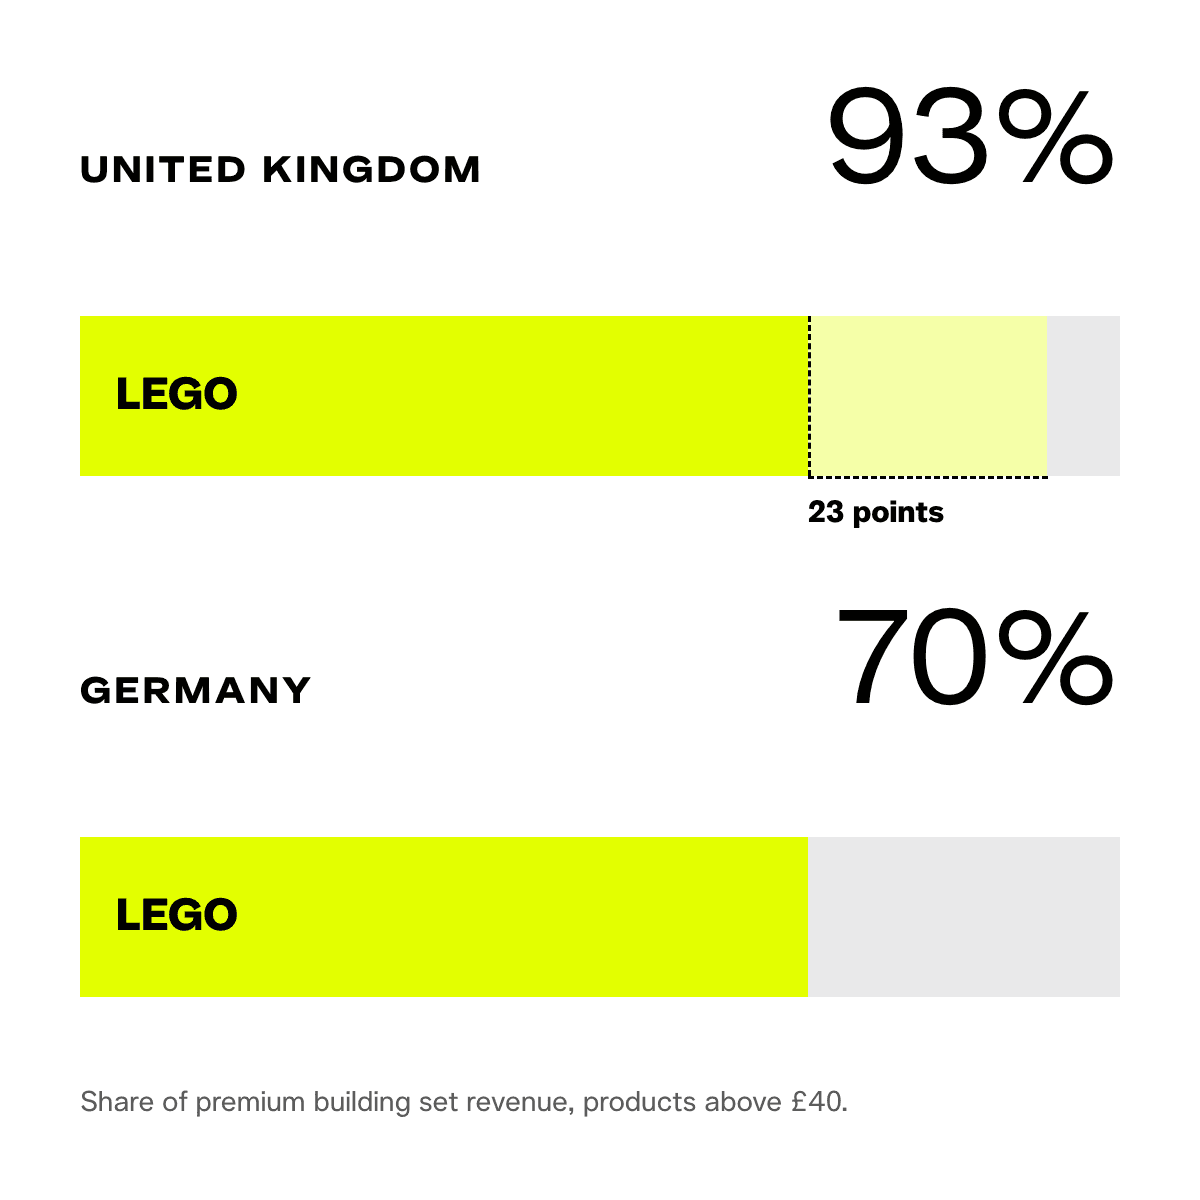
Premium building sets are five times larger than anything else on that list, and for a newcomer they are effectively closed. LEGO holds 93% of the revenue above £40. Whatever remains is being fought over by everyone else, against shoppers who searched for LEGO in the first place.
What makes this genuinely useful rather than merely discouraging is the German comparison. At home, LEGO holds 70% of the same pocket. Still dominant, but measurably looser. A German toy brand with a strong premium construction range, looking at a £104m British market, would be walking into a harder fight abroad than the one it already knows. That is exactly the kind of thing you want to find out in week three rather than month fourteen.
Baby and toddler sits at the other end of the same table. Comparable size once you account for the price tier, largest brand under 7%, and 58% of revenue flowing to products without deep review histories. That combination is what an accessible market looks like from the outside.
One trap worth flagging, because it catches experienced people. Read those two columns together or they will mislead you. Trading cards show 51% of revenue going to low-review products, which taken alone suggests wide open space. It is nothing of the sort. Concentration sits at 5,626 with Pokémon holding 70%. The explanation is mundane once you see it: every new card set launches with zero reviews, so the measurement is picking up product release cycles rather than market access.
A second trap. Take these numbers per price band rather than per category. A category-level concentration figure averages across what are effectively separate markets sitting on top of each other. In a lighting project we ran, concentration measured 232 across the whole category and 6,539 above £50, because a single brand held 81% of the premium tier. Reading the category number alone would have pointed a premium manufacturer directly at a monopoly.
Step five: find out what the market pays extra for
Once you know which segments are open, the question shifts from where to what.
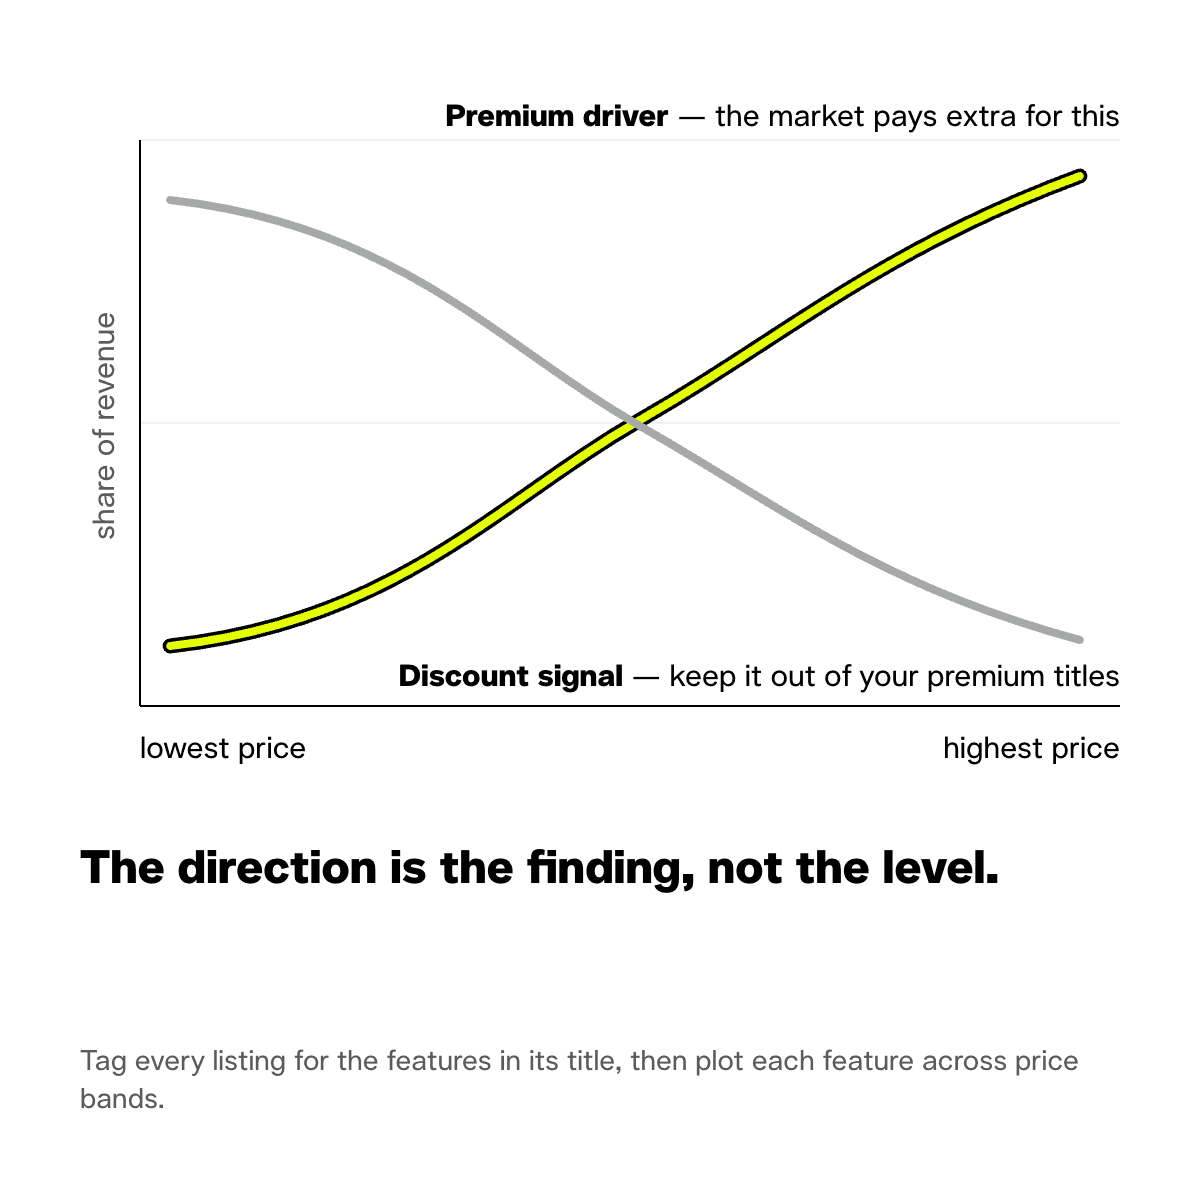
Rather than studying which individual products sell well, tag every listing for the attributes in its title. Licensing, material, age framing, gift positioning, educational claims, power source, whatever the category cares about. Then plot each attribute's share of revenue across price bands.
The reading is straightforward. An attribute whose share climbs as prices rise is something the market pays a premium for. One that falls away as prices rise is a signal of the discount end, and worth keeping out of your titles even if the product has the feature.
In UK premium building sets, licensed properties account for 52% of revenue between £40 and £60. In the German equivalent, 31%. Products positioned for adults and collectors reach 60% of UK revenue above £60 against 47% in Germany. Both markets reward the same two things and Britain rewards them considerably harder, which tells a product team something concrete about what to put in the box and on the packaging.
This step is where the genuine surprises tend to live. In a lighting project, the same analysis showed that cordless and rechargeable wall lights held 93% of UK revenue between £50 and £70, against 9% in the German equivalent. British housing stock, electrician costs and rental restrictions push buyers away from anything requiring wiring, and a manufacturer selling only hardwired fixtures was excluded from the top of that market without knowing it. No amount of studying bestseller lists produces that finding.
Step six: turn it into a shortlist and a brief
Two things come out of the other end.
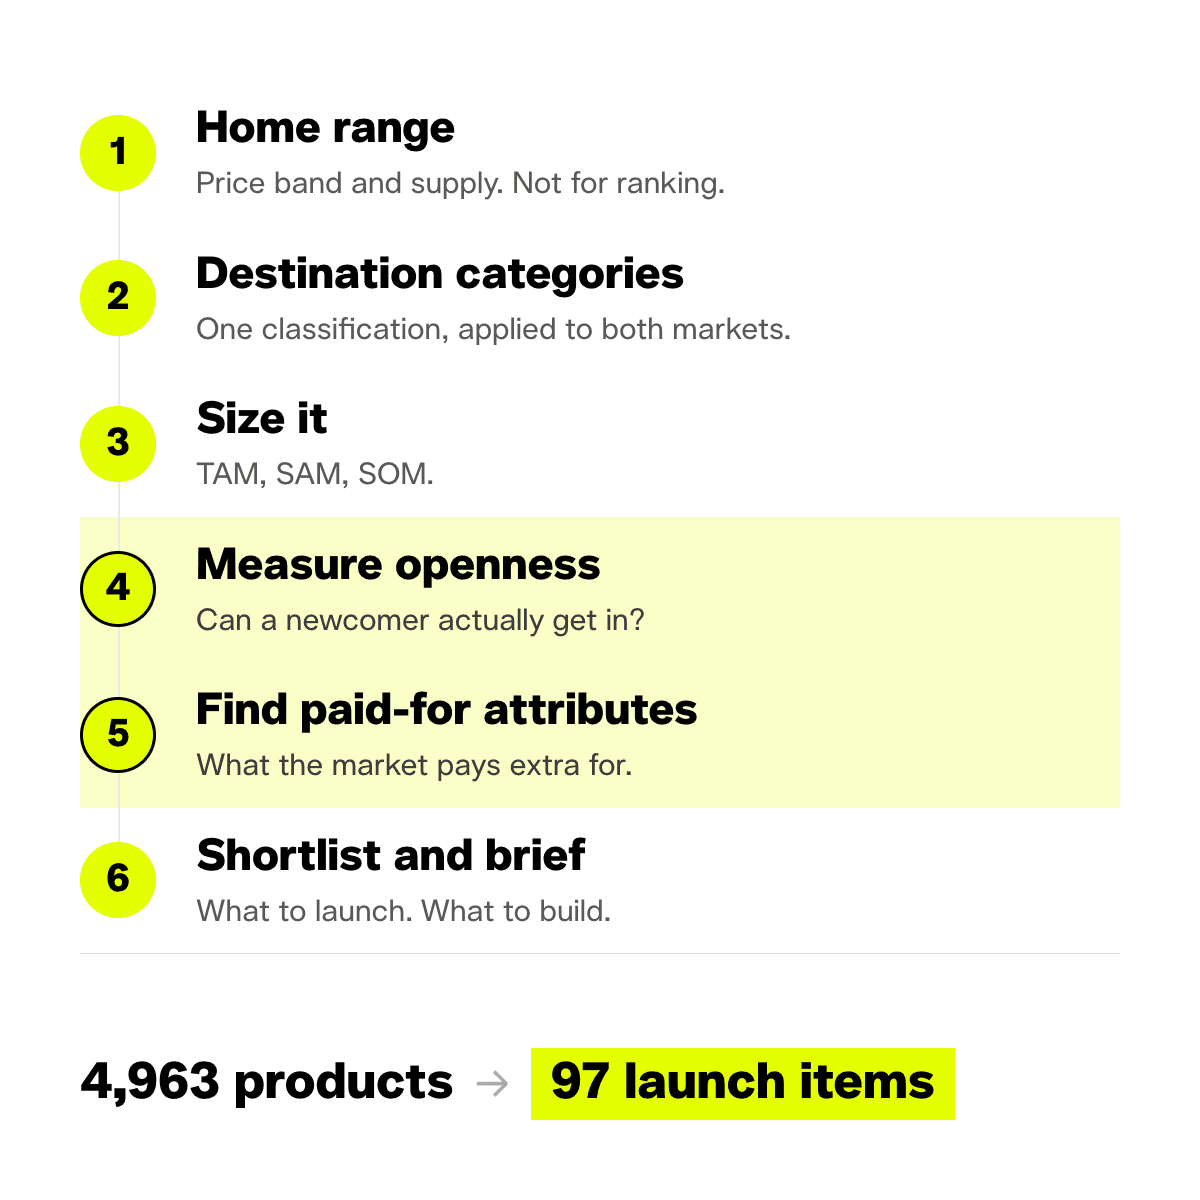
For the existing range, a ranked list of the specific products that fall inside the destination market's highest revenue-density price band. On a recent project that reduced a catalogue of 4,963 products to 97 launch items, which is a very different conversation to have with a supply chain team than "let's start with the bestsellers."
For product development, a specification: target price drawn from where revenue actually concentrates, features from the attribute analysis, competitive context from the concentration figures, and a realistic time-to-visibility read off the review levels in that segment. If the leading products in your chosen segment carry 700 reviews, you know roughly what the first year looks like before you start.
Both outputs are testable, which matters more than either being right. You launch against them, then check what the market does.
Running this in your own category
Toys are the worked example here, but nothing in the sequence is specific to them. This is the standard analysis we run before any market entry, whatever the category, because the alternative is committing inventory and media budget to an assumption. The mechanics stay identical from one project to the next. What changes are the findings, which is the entire reason for running it rather than reasoning it through.
The inputs are modest: a category export with revenue, price, brand and review counts, which most marketplace data tools provide, plus a product export from your own account.
The sequence, condensed:
- Home export for price band and supply, never for ranking
- Destination category export, classified with rules applied identically to both markets
- Segment comparison to find where the two markets differ in shape, then TAM, SAM and SOM to size what is actually yours
- Concentration and newcomer share, measured per price band rather than per category
- Attribute analysis to find what the destination market pays extra for
- Shortlist and product specification
Step four saves the most money. Step five produces the most surprises. Step two is the one people skip, and skipping it quietly invalidates everything after it.
What this will not tell you
Marketplace revenue figures from estimation tools carry roughly 20% uncertainty in either direction. They hold up well for structure, which is to say for questions about which segment is larger or more concentrated, and should be read as ranges wherever absolute values matter.
The analysis is silent on certification, compliance and logistics, and in some markets those turn out to be the binding constraint regardless of what demand looks like.
An open segment is not an easy one. Low concentration means no incumbent owns the space, which is a long way from saying you will take it. In several of the open segments above, the leading products carry 700 reviews or more, and building that is a twelve to eighteen month project rather than a quarter.
Finally, a marketplace is one channel among several. In UK lighting a substantial share of trade runs through builders' merchants and electrical wholesale, entirely outside Amazon. The method describes marketplace demand accurately, and we read it alongside whatever channel data a brand already has rather than in place of it.
Where to start
You almost certainly have both inputs already: a product export from your home marketplace account, and access to a category data tool.
We run this as the first step of any expansion programme, before a single listing goes live, because it is the cheapest point at which the assortment decision can still be changed. The analysis takes a few weeks. Launching without it takes eighteen months to reach the same answer, and the eighteen-month version comes with inventory attached.